
Trading Truth Concepts
TradingViewProfessional Supply & Demand Structure Decoder
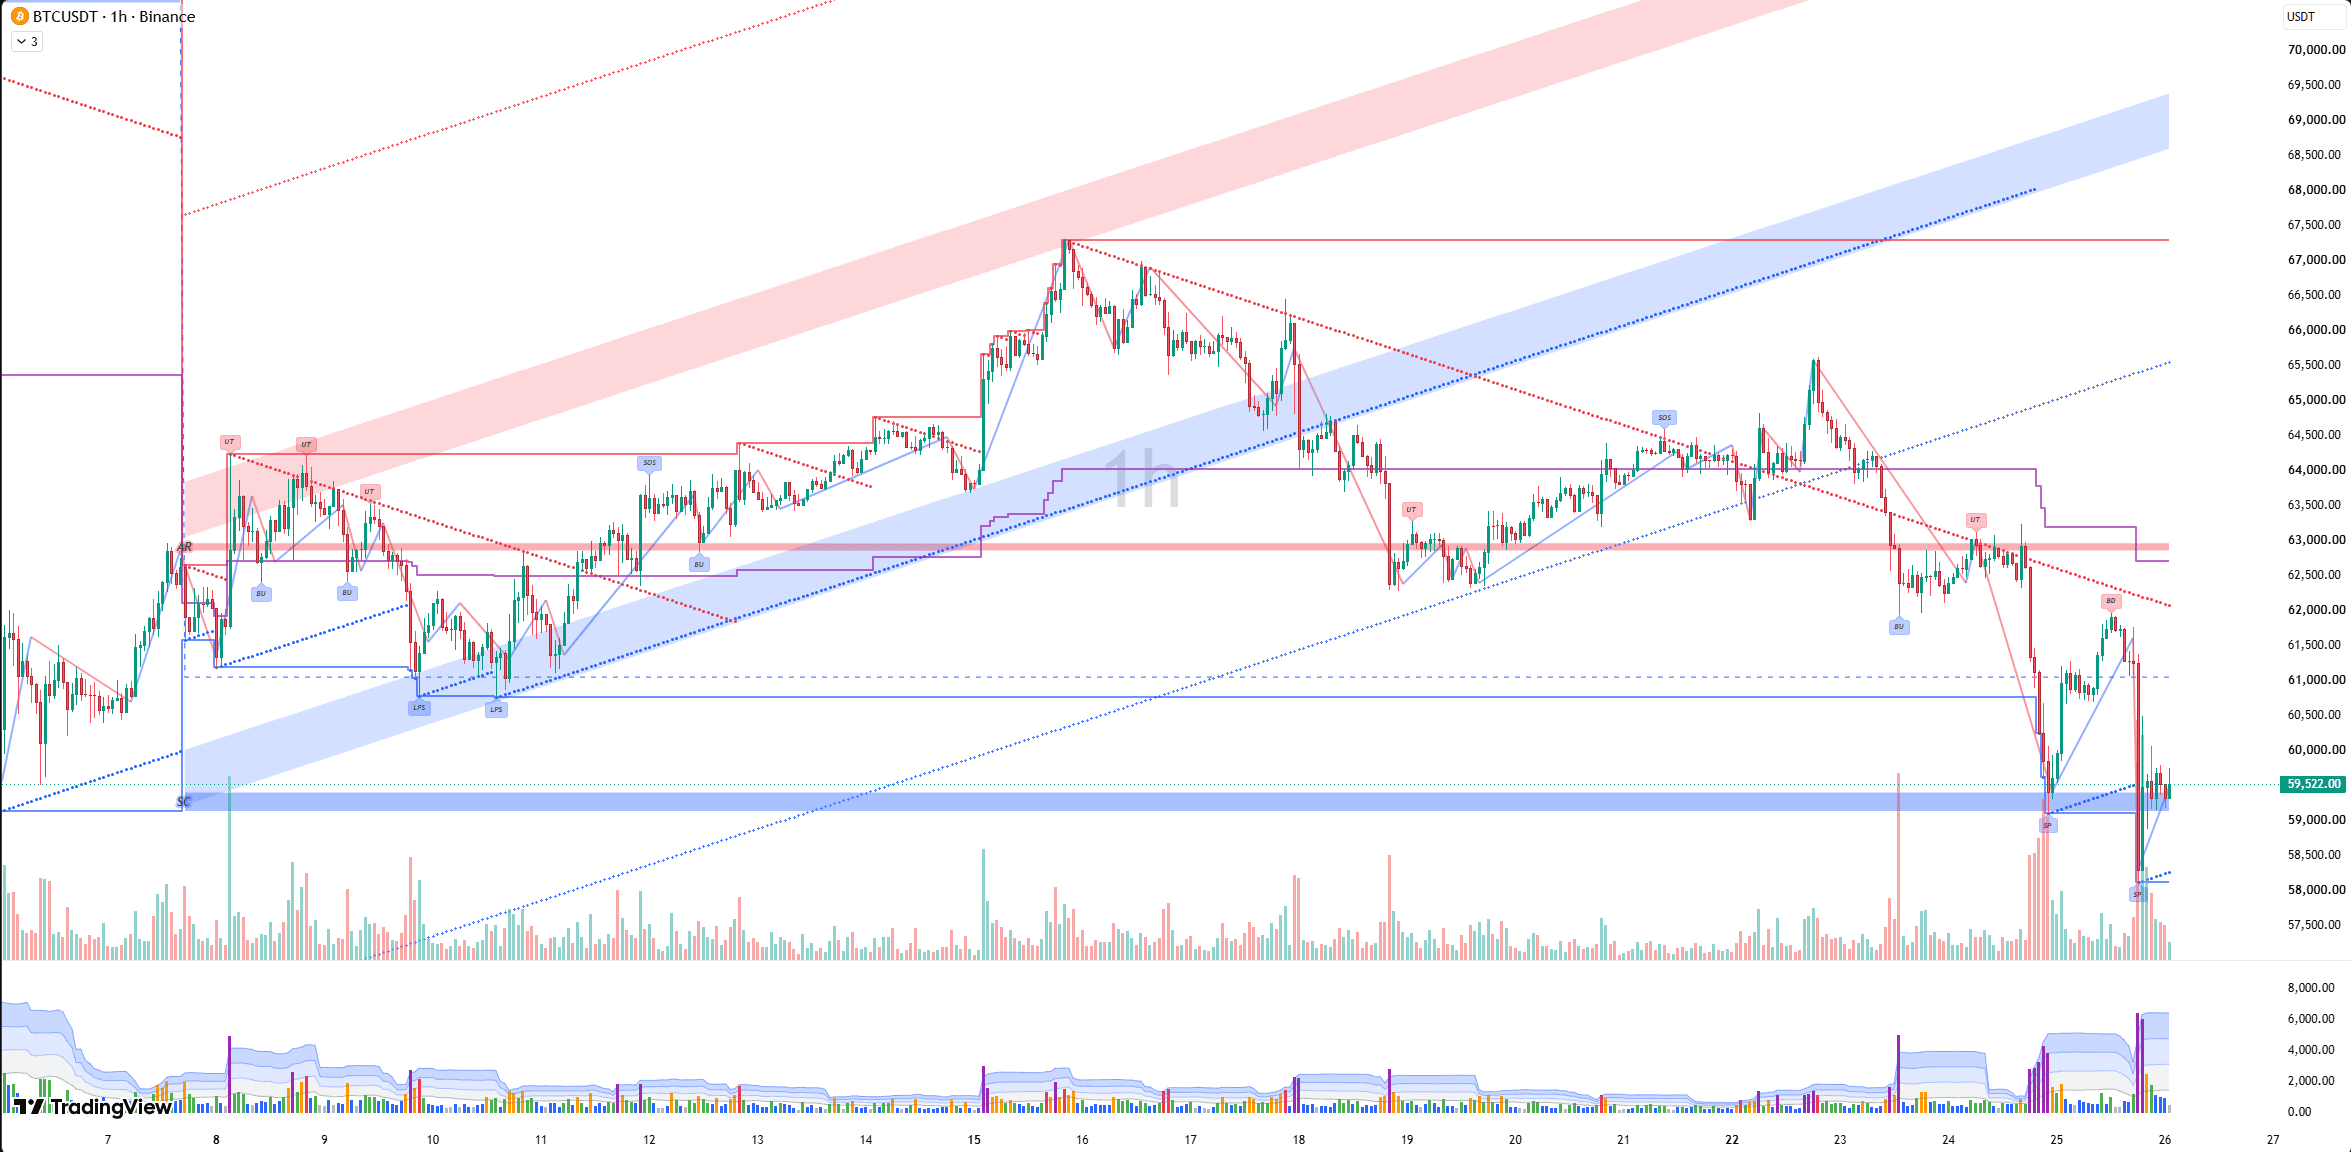
Implements Richard D. Wyckoff's legendary market analysis framework, automatically detecting accumulation and distribution patterns.
Markets
Recommended Timeframes
Key Features
- Full Wyckoff accumulation structure detection
- Full Wyckoff distribution structure detection
- Automatic AR, ST, Creek, BC identification
- 4-level target projection (TP1-TP4)
- Spring & Upthrust detection
- HTF geometric structure integration
- Comprehensive alert system
Overview
This indicator implements Richard D. Wyckoff's legendary market analysis framework, automatically detecting accumulation and distribution patterns while mapping the battle between Smart Money and retail traders—delivering precision entries based on institutional behavior. The system automatically detects and plots complete accumulation and distribution structures. For accumulation, it identifies: Automatic Rally (AR), Secondary Test (ST), Creek (midpoint), Spring (false breakdown), and Buying Climax (BC). For distribution, it identifies: Buying Climax (BC), Automatic Reaction (AR), Creek, Upthrust (false breakout), and Secondary Test (ST). The system includes 4-level target projection based on Wyckoff's Cause & Effect law, geometric structure enhancements (ascending/descending 1/1 structures, structure channels, SQ9 time forecast), and comprehensive alert system for all Wyckoff events.
Complete Documentation
Full release notes and trading guide
================================================================================
📊 WYCKOFF TRADING SYSTEM v1.0
🎯 Professional Supply & Demand Structure Decoder
================================================================================

This indicator implements Richard D. Wyckoff's legendary market analysis
framework, automatically detecting accumulation and distribution patterns while
mapping the battle between Smart Money and retail traders—delivering precision
entries based on institutional behavior.

================================================================================
🧠 THE WYCKOFF METHOD (Foundation)
================================================================================

💡 CORE WYCKOFF PRINCIPLES

1️⃣ SUPPLY & DEMAND
→ Price movement is governed by the law of supply and demand

2️⃣ CAUSE & EFFECT
→ Accumulation/Distribution (CAUSE) creates the fuel for markup/markdown
(EFFECT)

3️⃣ EFFORT VS. RESULT
→ Volume (Effort) should confirm price movement (Result)

4️⃣ COMPOSITE OPERATOR
→ Smart Money leaves footprints—learn to read them

================================================================================
🔵 ACCUMULATION (DEMAND BUILDING PHASE)
================================================================================

Accumulation occurs after a downtrend when Smart Money begins absorbing supply
at wholesale prices. The system automatically detects and plots the complete
accumulation structure.

--------------------------------------------------------------------------------
🧱 ACCUMULATION PRICE STRUCTURE
--------------------------------------------------------------------------------

The system plots dynamic price structure levels that define the accumulation
trading range:

🟢 AR (Automatic Rally)
→ Initial bounce after selling climax—first sign of demand

🔴 ST (Secondary Test)
→ Retest of the low with lower volume—confirms absorption

⚪ Creek
→ Midpoint of the range—equilibrium between supply and demand

🟡 SOW (Sign of Weakness) / SPRING
→ False breakdown to shake out weak hands

🔵 BC (Buying Climax)
→ Top of the accumulation range—supply resistance

--------------------------------------------------------------------------------
📊 ACCUMULATION TARGET LEVELS (Markup Phase)
--------------------------------------------------------------------------------

Once accumulation completes, the system projects 4 upside targets:

🎯 TP1 (25%) → Conservative profit zone—early markup
🎯 TP2 (50%) → Mid-range target—trend confirmation
🎯 TP3 (75%) → Extended target—strong institutional push
🎯 TP4 (100%) → Full projection—maximum effect from cause

💡 PRO TIP: Target distance is proportional to the WIDTH of accumulation—
wider ranges create larger markup potential (Cause = Effect).

--------------------------------------------------------------------------------
🟢 BULLISH WYCKOFF EVENTS (Long Setups)
--------------------------------------------------------------------------------

🌀 SPRING (False Breakdown)
→ Price breaks below support, then quickly reverses
→ Shakes out weak longs and triggers stops
→ 📥 Entry: On reclaim of support with volume spike
→ 🛑 Stop: Below spring low
→ 🎯 Target: Creek → TP1 → TP2 → TP3/TP4

🔄 TEST OF SPRING
→ Price retests the spring low area on lighter volume
→ Confirms absorption of supply
→ 📥 Entry: Bounce from spring test zone with bullish candle
→ 🛑 Stop: Below spring low
→ 🎯 Target: Creek → AR → Targets

💚 LAST POINT OF SUPPORT (LPS)
→ Final healthy pullback before markup begins
→ Low volume dip—supply exhausted
→ 📥 Entry: Bounce with increasing volume
→ 🛑 Stop: Below creek or spring
→ 🎯 Target: AR → TP1 → TP2+

🚀 BACKING UP ACTION (BUA)
→ Minor pullback after Sign of Strength (SOS)
→ Price holds above AR—confirms demand control
→ 📥 Entry: Dip buy with volume confirmation
→ 🛑 Stop: Below AR
→ 🎯 Target: TP1 → TP2 → TP3 → TP4

--------------------------------------------------------------------------------
🔴 BEARISH WYCKOFF EVENTS (Short Traps)
--------------------------------------------------------------------------------

These events occur DURING accumulation but are bearish traps:

⚠️ UPTHRUST (False Breakout)
→ Price breaks above resistance, then fails
→ Traps early bulls—creates liquidity
→ 📤 Entry: Breakdown back into range
→ 🛑 Stop: Above upthrust high
→ 🎯 Target: Creek → ST

🔁 TEST OF UPTHRUST
→ Retest of upthrust high with rejection
→ 📤 Entry: Rejection with bearish volume
→ 🛑 Stop: Above upthrust
→ 🎯 Target: Creek → Support

⚫ LAST POINT OF SUPPLY (LPSY)
→ Failed rally attempt within range
→ 📤 Entry: Breakdown confirmation
→ 🛑 Stop: Above LPSY
→ 🎯 Target: ST → Spring zone

💀 BREAKING DOWN ACTION
→ Failure to hold support—distribution signal
→ 📤 Entry: Breakdown with expanding volume
→ 🛑 Stop: Above broken support
→ 🎯 Target: Lower structure

================================================================================
🔴 DISTRIBUTION (SUPPLY RELEASING PHASE)
================================================================================

Distribution occurs after an uptrend when Smart Money begins unloading shares
at retail prices. The system automatically detects and plots the complete
distribution structure.

--------------------------------------------------------------------------------
🧱 DISTRIBUTION PRICE STRUCTURE
--------------------------------------------------------------------------------

🔵 BC (Buying Climax)
→ Final surge of buying—euphoria peak

🟢 AR (Automatic Reaction)
→ Sharp pullback as Smart Money sells into strength

⚪ Creek
→ Midpoint of the range—equilibrium

🟡 UT (Upthrust)
→ False breakout to trap late bulls

🔴 ST (Secondary Test)
→ Retest of BC high with weaker volume—confirms distribution

--------------------------------------------------------------------------------
📊 DISTRIBUTION TARGET LEVELS (Markdown Phase)
--------------------------------------------------------------------------------

Once distribution completes, the system projects 4 downside targets:

🎯 TP1 (25%) → First decline zone
🎯 TP2 (50%) → Mid-distribution drop
🎯 TP3 (75%) → Deep retracement
🎯 TP4 (100%) → Full collapse projection

--------------------------------------------------------------------------------
🔴 BEARISH WYCKOFF EVENTS (Short Setups)
--------------------------------------------------------------------------------

💥 UPTHRUST (False Breakout)
→ Price breaks above BC, then reverses sharply
→ Traps late bulls—creates sell pressure
→ 📤 Entry: Breakdown back into range with volume
→ 🛑 Stop: Above upthrust high
→ 🎯 Target: Creek → TP1 → TP2 → TP3/TP4

🔁 TEST OF UPTHRUST
→ Retest of upthrust area on lighter volume
→ Confirms supply dominance
→ 📤 Entry: Rejection with bearish candle
→ 🛑 Stop: Above upthrust
→ 🎯 Target: Creek → AR → Targets

🔴 LAST POINT OF SUPPLY (LPSY)
→ Final rally attempt before markdown
→ Low volume rally—demand exhausted
→ 📤 Entry: Rejection with increasing sell volume
→ 🛑 Stop: Above creek or upthrust
→ 🎯 Target: AR → TP1 → TP2+

💀 BREAKING DOWN ACTION
→ Price fails to hold support—markdown begins
→ 📤 Entry: Breakdown confirmation with volume
→ 🛑 Stop: Above broken support
→ 🎯 Target: TP1 → TP2 → TP3 → TP4

--------------------------------------------------------------------------------
🟢 BULLISH WYCKOFF EVENTS (Buy Traps)
--------------------------------------------------------------------------------

These events occur DURING distribution but are bullish traps:

🌀 SPRING (False Support Break)
→ Price breaks below range support, then recovers
→ Traps early bears
→ 📥 Entry: Reclaim of support
→ 🛑 Stop: Below spring
→ 🎯 Target: Creek → BC

🔄 TEST OF SPRING
→ Retest of spring low
→ 📥 Entry: Bounce confirmation
→ 🛑 Stop: Below spring
→ 🎯 Target: Creek → Resistance

💚 LAST POINT OF SUPPORT (LPS)
→ Temporary support within distribution
→ 📥 Entry: Bounce with volume
→ 🛑 Stop: Below LPS
→ 🎯 Target: Creek → AR

🚀 BACKING UP ACTION
→ Minor pullback that holds
→ 📥 Entry: Continuation move
→ 🛑 Stop: Below support
→ 🎯 Target: Higher structure

================================================================================
📐 GEOMETRIC STRUCTURE ENHANCEMENTS
================================================================================

Beyond classic Wyckoff, the system integrates geometric analysis:

--------------------------------------------------------------------------------
📐↗️ ASCENDING 1/1 STRUCTURE
--------------------------------------------------------------------------------

- Plots dynamic ascending trendlines from accumulation lows
- 1x1 angle (45°) represents balanced demand momentum
- Parallel lines create ascending channels
- Price should respect these lines during markup

💡 USAGE: Trade bounces off ascending 1x1 during markup phase

--------------------------------------------------------------------------------
📐↘️ DESCENDING 1/1 STRUCTURE
--------------------------------------------------------------------------------

- Plots dynamic descending trendlines from distribution highs
- 1x1 angle (45°) represents balanced supply momentum
- Parallel lines create descending channels
- Price should respect these lines during markdown

💡 USAGE: Trade rejections off descending 1x1 during markdown phase

--------------------------------------------------------------------------------
📦📐 STRUCTURE CHANNELS
--------------------------------------------------------------------------------

- Automatic channel detection for accumulation/distribution
- Identifies range highs and lows
- Parallel channel boundaries
- Dynamic adjustment as structure develops

💡 USAGE: Fade extremes in ranging markets, breakout in trending markets

--------------------------------------------------------------------------------
⏳📐 TIME FORECAST (SQ9)
--------------------------------------------------------------------------------

- Gann Square of 9 time projections
- Vertical lines mark natural reversal points
- Based on price structure completion
- Projects future cycle timing

💡 USAGE: Combine with Wyckoff events for high-probability entries

--------------------------------------------------------------------------------
🟢⬆️🔴⬇️ HH/LL SINCE AR
--------------------------------------------------------------------------------

- Tracks Higher Highs (HH) and Lower Lows (LL) after AR
- Confirms trend direction post-accumulation/distribution
- Visual swing structure mapping
- Identifies breakout strength

💡 USAGE: Confirms markup/markdown phase progression

================================================================================
🎯 COMPLETE TRADE RULES (Playbook)
================================================================================

--------------------------------------------------------------------------------
🟢 ACCUMULATION LONG RULES (Buy Setups)
--------------------------------------------------------------------------------

Setup 1: Spring Entry
📊 Context: Accumulation detected, price springs below support
📥 Entry: Price reclaims support with ultra-high volume
🛑 Stop: Below spring low (-1 ATR)
🎯 TP: Creek (25%) → AR (50%) → TP1 (75%) → TP2/TP3 (trail)
📊 Volume: Ultra-high on reversal = stronger setup

Setup 2: Test of Spring
📊 Context: After spring, price retests low on lighter volume
📥 Entry: Bounce from test zone with bullish candle
🛑 Stop: Below spring low
🎯 TP: Creek → AR → Targets
📊 Volume: Lower volume on test = healthy

Setup 3: Last Point of Support (LPS)
📊 Context: Price dips after SOS, holds above key level
📥 Entry: Bounce with increasing volume
🛑 Stop: Below creek or 1x1 ascending line
🎯 TP: TP1 → TP2 → TP3 → TP4
📊 Volume: Rising volume on bounce = confirmation

Setup 4: Backing Up Action (BUA)
📊 Context: Minor pullback after breaking resistance
📥 Entry: Dip buy with volume confirmation
🛑 Stop: Below AR or 1x1 line
🎯 TP: TP1 → TP2 → TP3 → TP4
📊 Volume: Low volume dip + high volume bounce

Setup 5: Geometric Confluence
📊 Context: Price at ascending 1x1 + Wyckoff support + SQ9 time
📥 Entry: Triple confluence with volume spike
🛑 Stop: Below geometric structure
🎯 TP: TP1 → TP2 → TP3 → TP4
📊 Volume: Ultra-high at entry = best setup

--------------------------------------------------------------------------------
🔴 DISTRIBUTION SHORT RULES (Sell Setups)
--------------------------------------------------------------------------------

Setup 1: Upthrust Entry
📊 Context: Distribution detected, price upthrusts above BC
📤 Entry: Price fails back into range with ultra-high volume
🛑 Stop: Above upthrust high (+1 ATR)
🎯 TP: Creek (25%) → AR (50%) → TP1 (75%) → TP2/TP3 (trail)
📊 Volume: Ultra-high on rejection = stronger setup

Setup 2: Test of Upthrust
📊 Context: After upthrust, price retests high on lighter volume
📤 Entry: Rejection from test zone with bearish candle
🛑 Stop: Above upthrust high
🎯 TP: Creek → AR → Targets
📊 Volume: Lower volume on test = healthy

Setup 3: Last Point of Supply (LPSY)
📊 Context: Price rallies after SOW, fails at key level
📤 Entry: Rejection with increasing volume
🛑 Stop: Above creek or 1x1 descending line
🎯 TP: TP1 → TP2 → TP3 → TP4
📊 Volume: Rising volume on rejection = confirmation

Setup 4: Breaking Down Action
📊 Context: Price breaks major support
📤 Entry: Breakdown confirmation with expanding volume
🛑 Stop: Above broken support or 1x1 line
🎯 TP: TP1 → TP2 → TP3 → TP4
📊 Volume: Expanding volume on breakdown

Setup 5: Geometric Confluence
📊 Context: Price at descending 1x1 + Wyckoff resistance + SQ9 time
📤 Entry: Triple confluence with volume spike
🛑 Stop: Above geometric structure
🎯 TP: TP1 → TP2 → TP3 → TP4
📊 Volume: Ultra-high at entry = best setup

================================================================================
🔔 SMART ALERT SYSTEM (Built-In)
================================================================================

The system includes comprehensive alert capabilities for all Wyckoff events:

--------------------------------------------------------------------------------
🔵 ACCUMULATION ALERTS
--------------------------------------------------------------------------------

✅ Spring Detection
✅ Test of Spring
✅ Last Point of Support (LPS)
✅ Backing Up Action
✅ Upthrust (Bear Trap)
✅ Test of Upthrust
✅ Last Point of Supply (LPSY)
✅ Breaking Down Action

--------------------------------------------------------------------------------
🔴 DISTRIBUTION ALERTS
--------------------------------------------------------------------------------

✅ Upthrust Detection
✅ Test of Upthrust
✅ Last Point of Supply (LPSY)
✅ Breaking Down Action
✅ Spring (Bull Trap)
✅ Test of Spring
✅ Last Point of Support (LPS)
✅ Backing Up Action

--------------------------------------------------------------------------------
📲 HOW TO SET UP ALERTS
--------------------------------------------------------------------------------

1. Add indicator to chart
2. Click "Alerts" button (⏰ icon)
3. Select "Wyckoff Trading System"
4. Choose "Any alert() function call"
5. Customize message and delivery method
6. Click "Create"

💡 PRO TIP: Enable only the events you trade for cleaner notifications

================================================================================
⚙️ INDICATOR SETTINGS (Customization)
================================================================================

--------------------------------------------------------------------------------
🔵 ACCUMULATION PLOT SETTINGS
--------------------------------------------------------------------------------

🧱 Price Structure
- Toggle accumulation structure display
- AR, ST, Creek, BC, SOW levels
- Dynamic structure updates

📊 Event Labels
- Show/hide Wyckoff event labels
- Spring, LPS, BUA, etc.
- Custom label positioning

🎯 Target Levels
- Enable/disable TP1, TP2, TP3, TP4
- Show/hide target labels
- Extend lines to the right

📐 Geometric Enhancements
- HTF Ascending 1/1 Structure
- Structure Channels
- SQ9 Time Forecast
- HH/LL Tracking Since AR
- Ascending Parallel Lines

🔵 Event Toggles
- Springs
- Test of Springs
- Last Point of Support (LPS)
- Backing Up Action
- Upthrusts (Bear Traps)
- Test of Upthrusts
- Last Point of Supply (LPSY)
- Breaking Down Action

--------------------------------------------------------------------------------
🔴 DISTRIBUTION PLOT SETTINGS
--------------------------------------------------------------------------------

🧱 Price Structure
- Toggle distribution structure display
- BC, AR, Creek, ST, UT levels
- Dynamic structure updates

📊 Event Labels
- Show/hide Wyckoff event labels
- Upthrust, LPSY, Breaking Down, etc.
- Custom label positioning

🎯 Target Levels
- Enable/disable TP1, TP2, TP3, TP4
- Show/hide target labels
- Extend lines to the right

📐 Geometric Enhancements
- HTF Descending 1/1 Structure
- Structure Channels
- SQ9 Time Forecast
- HH/LL Tracking Since AR
- Descending Parallel Lines

🔴 Event Toggles
- Upthrusts
- Test of Upthrusts
- Last Point of Supply (LPSY)
- Breaking Down Action
- Springs (Bull Traps)
- Test of Springs
- Last Point of Support (LPS)
- Backing Up Action

--------------------------------------------------------------------------------
🎯 TRADE SIGNAL SETTINGS
--------------------------------------------------------------------------------

📈 Show Wyckoff Trade Signals
- Automatic long/short signal generation
- Based on confirmed Wyckoff events
- Visual markers on chart

--------------------------------------------------------------------------------
🚨 ALERT SETTINGS
--------------------------------------------------------------------------------

🔔 Master Alert Toggle
- Enable/disable all Wyckoff alerts

🔵 Accumulation Alerts
- Enable/disable all accumulation event alerts

🔴 Distribution Alerts
- Enable/disable all distribution event alerts

================================================================================
📊 HIGHER TIMEFRAME CONTEXT (Auto-Detection)
================================================================================

The system automatically maps your current timeframe to the optimal HTF for
structural context:

⏱️ AUTO HTF MAPPING

Current TF → HTF Context Purpose
──────────────────────────────────────────────────────────────
5 seconds → 15m Scalper's structural frame
1 minute → 1D Intraday anchor
5 minutes → 3D Swing trader's guide
15 minutes → 1W Position structure
1 hour → 1M Investor's roadmap
4 hours → 3M (Q) Quarterly rhythm
Daily → 12M (Y) Annual cycle

💡 WHY THIS MATTERS: Wyckoff patterns on HTF provide directional bias for
lower timeframe entries. Trade WITH the HTF pattern, not against it.

================================================================================
💎 PRO TRADING NOTES
================================================================================

🎯 WYCKOFF CONFLUENCE STRATEGY

Best Setups: Wyckoff Event + Volume Spike + Geometric Level + Time Cycle

Example: Spring at ascending 1x1 angle during SQ9 time forecast with
ultra-high volume = monster long trade

--------------------------------------------------------------------------------
📊 VOLUME INTERPRETATION
--------------------------------------------------------------------------------

Accumulation Phase:
• Declining volume = Healthy absorption
• Volume spike on spring = Demand kicking in
• Increasing volume on SOS = Markup beginning

Distribution Phase:
• Declining volume = Supply being released quietly
• Volume spike on upthrust = Rejection
• Increasing volume on SOW = Markdown beginning

Entry Quality:
• Ultra-High volume on reversal = Best entries
• Very High volume on breakout = Strong continuation
• Low volume on tests = Healthy retest

--------------------------------------------------------------------------------
🧠 SMART MONEY BEHAVIOR
--------------------------------------------------------------------------------

Accumulation = Smart Money BUYING from Weak Hands
→ Look for: Springs, tests, decreasing volume
→ Avoid: Buying into upthrusts during ranging phase

Distribution = Smart Money SELLING to Weak Hands
→ Look for: Upthrusts, tests, decreasing volume
→ Avoid: Shorting into springs during topping phase

--------------------------------------------------------------------------------
📐 GEOMETRIC INTEGRATION
--------------------------------------------------------------------------------

1x1 Ascending Lines (Accumulation):
• Use as dynamic support during markup
• Buy dips to ascending structure
• Trail stops along 1x1 line

1x1 Descending Lines (Distribution):
• Use as dynamic resistance during markdown
• Sell rallies to descending structure
• Trail stops along 1x1 line

Structure Channels:
• Fade extremes during ranging (accumulation/distribution)
• Breakout trades when range completes
• Measure channel width for target projection

--------------------------------------------------------------------------------
⏰ TIME CYCLE STRATEGY
--------------------------------------------------------------------------------

SQ9 Time Forecast Lines:
• Natural reversal points based on Gann's Square of 9
• Combine with Wyckoff events for precision timing
• Price often reacts (reversal or acceleration) at these times

Best Practice:
• Enter Wyckoff setups BEFORE time forecast line
• Take profits or tighten stops AT time forecast line
• Watch for confirmation after time line (continuation or reversal)

--------------------------------------------------------------------------------
🎨 CAUSE & EFFECT LAW
--------------------------------------------------------------------------------

The Cardinal Rule: WIDTH of Range × Time = MAGNITUDE of Move

Wide Accumulation = Large Markup
→ 500-point range × 3 months = expect 500+ point rally

Narrow Distribution = Modest Markdown
→ 200-point range × 2 weeks = expect ~200 point decline

💡 PRO TIP: Measure the trading range width and multiply by number of bars
to estimate the subsequent trend's potential.

================================================================================
🆘 TROUBLESHOOTING
================================================================================

Q: Not seeing any Wyckoff structures?
A: - Wyckoff patterns form after significant trends complete
- Check that you're on a timeframe where ranges are visible (15m-1D work best)
- Ensure "Enable Accumulation/Distribution Plots" is ON
- Patterns take time to develop—be patient

Q: Too many lines and labels?
A: - Start with just Price Structure + Target Levels
- Disable individual event labels you don't trade
- Hide geometric enhancements until you understand basic Wyckoff
- Use clean chart for analysis, detailed for execution

Q: Events not showing?
A: - Individual event toggles must be enabled (Springs, LPS, etc.)
- Events only plot when specific conditions are met
- Some events are rare (springs only occur in specific conditions)
- Check that structure has been identified first

Q: Targets seem unrealistic?
A: - Targets are based on Wyckoff's Cause & Effect law
- Wider ranges = larger targets (this is correct behavior)
- Use TP1/TP2 for conservative exits, TP3/TP4 for runners
- Not all targets will be hit—it's a projection, not guarantee

Q: How to know if accumulation/distribution is complete?
A: - Sign of Strength (SOS) breaking AR = accumulation likely complete
- Sign of Weakness (SOW) breaking AR = distribution likely complete
- Wait for backing up action or test before entering
- Volume should increase on breakout

Q: Can I use this for scalping?
A: - ✅ Yes, but use HTF Wyckoff structure for bias
- Scalp WITH the HTF pattern direction
- Lower timeframes (1m, 5m) will show mini accumulation/distribution
- Focus on springs/upthrusts for quick entries

Q: Does this work on all markets?
A: - ✅ Crypto (24/7)
- ✅ Forex (24/5)
- ✅ Stocks (limited hours)
- ✅ Futures
- ✅ Commodities
- System auto-adjusts for market type and trading hours

Q: Best timeframes for Wyckoff?
A: - Day Trading: 15m, 1H (HTF: 1D, 1W)
- Swing Trading: 4H, 1D (HTF: 1W, 1M)
- Position Trading: 1D, 1W (HTF: 1M, 3M)
- Scalping: 1m, 5m (HTF: 15m, 1H)

Q: Repainting issues?
A: - Structure levels update as price develops (expected behavior)
- Confirmed events do NOT repaint
- Final structure locks after confirmation
- Alerts fire once and do not change

Q: How to combine with other indicators?
A: - RSI: Oversold during springs, overbought during upthrusts
- MACD: Divergence confirms springs/upthrusts
- Volume Profile: POC aligns with creek
- Moving Averages: 50/200 SMA confirm trend direction
- Fibonacci: Retracements align with Wyckoff levels

================================================================================
📜 VERSION HISTORY
================================================================================

v1.0 (Current - January 2025)
✅ Full Wyckoff accumulation structure detection
✅ Full Wyckoff distribution structure detection
✅ Automatic AR, ST, Creek, BC, SOW/UT identification
✅ 4-level target projection (TP1-TP4)
✅ Spring & Test of Spring detection
✅ Upthrust & Test of Upthrust detection
✅ Last Point of Support (LPS) detection
✅ Last Point of Supply (LPSY) detection
✅ Backing Up Action identification
✅ Breaking Down Action identification
✅ HTF Ascending 1/1 geometric structure
✅ HTF Descending 1/1 geometric structure
✅ Structure channel plotting
✅ Gann Square of 9 time forecast
✅ HH/LL tracking since AR
✅ Parallel geometric lines
✅ Comprehensive alert system
✅ Trade signal generation
✅ Auto HTF detection and mapping
✅ Multi-market support
✅ Customizable plot toggles
✅ Event label management

Planned v2.0
🔜 Phase labeling (A, B, C, D, E)
🔜 Composite Operator intent scoring
🔜 Automated Cause/Effect calculations
🔜 Multi-timeframe structure alignment
🔜 Volume Spread Analysis integration
🔜 Effort vs. Result divergence alerts
🔜 Advanced pattern recognition (PS, SC, etc.)

================================================================================
🧠 THE WYCKOFF METHOD EXPLAINED
================================================================================

Richard D. Wyckoff's Core Teachings

📘 THE THREE LAWS

1. Law of Supply and Demand
→ Excess demand = Prices rise
→ Excess supply = Prices fall
→ Balance = Sideways (accumulation/distribution)

2. Law of Cause and Effect
→ Horizontal movement (cause) precedes vertical movement (effect)
→ The longer the cause, the greater the effect
→ This indicator measures cause to project effect (targets)

3. Law of Effort vs. Result
→ Volume (effort) should align with price movement (result)
→ Divergence signals change: high volume + no movement = absorption
→ Low volume + big movement = institutional participation

📗 MARKET CYCLE PHASES

Phase A: Stopping Action
- Selling climax (accumulation) or buying climax (distribution)
- Automatic rally/reaction
- Secondary test
- Purpose: Halt prior trend

Phase B: Building Cause
- Trading range forms
- Smart Money accumulates/distributes
- Tests and shakeouts occur
- Purpose: Build position

Phase C: Testing
- Springs (accumulation) or upthrusts (distribution)
- Final test of commitment
- Determines if enough cause built
- Purpose: Confirm readiness for markup/markdown

Phase D: Trend Emerging
- Signs of strength (SOS) or weakness (SOW)
- Last point of support/supply
- Backing up or breaking down
- Purpose: Early trend confirmation

Phase E: Markup or Markdown
- Full trend in motion
- Effect playing out from cause
- Targets being hit
- Purpose: Realize profits from range-built cause

================================================================================
⚠️ RISK DISCLAIMER
================================================================================

This indicator is an EDUCATIONAL TOOL based on Richard D. Wyckoff's market
analysis principles. It does NOT guarantee profits. Trading involves
substantial risk of loss.

⚠️ Always use stop losses
📊 Size positions based on account risk (1-2% per trade)
🧠 Combine with proper risk management
📈 Backtest before live trading
💡 No system wins 100% of the time
📚 Continue learning Wyckoff methodology

Wyckoff analysis is a SKILL that improves with study and practice. This
indicator accelerates your learning by automatically identifying structures,
but YOU must develop the judgment to trade them profitably.

================================================================================
🎓 LEARNING PATH
================================================================================

BEGINNER (Weeks 1-2)
1. Study accumulation vs. distribution concepts
2. Learn to identify AR, ST, Creek on your charts
3. Paper trade springs and upthrusts only
4. Focus on ONE market (e.g., BTC or SPY)
5. Use higher timeframes (4H, 1D) for clarity

INTERMEDIATE (Weeks 3-6)
6. Add LPS and LPSY to your playbook
7. Incorporate volume analysis (effort vs. result)
8. Start combining Wyckoff + geometric structure
9. Practice cause/effect target projections
10. Trade live with 0.5-1% risk per trade

ADVANCED (Months 2-6)
11. Master all events (BUA, breaking down, tests)
12. Multi-timeframe Wyckoff structure alignment
13. Develop custom confluence strategies
14. Recognize distribution during euphoria
15. Identify accumulation during fear
16. Build position sizing around cause measurement

EXPERT (6+ Months)
17. Read institutional footprints in real-time
18. Predict phase transitions (B→C, D→E)
19. Combine with order flow and volume profile
20. Teach others and refine through mentoring

================================================================================
💬 FINAL WORDS FROM THE ARCHITECT
================================================================================

"The tape tells all. The market is not driven by emotions or hope—it's
driven by the battle between supply and demand. Learn to read the footprints
of Smart Money, and you'll always know what's coming next."

Richard D. Wyckoff proved that markets are NOT random—they follow predictable
patterns created by the Composite Operator (Smart Money). This indicator
automates the structure detection, but YOUR edge comes from understanding
the WHY behind each pattern.

Study the method. Trust the process. Trade with the Composite Operator, not
against them.

"Every phase has a purpose. Every test reveals intent. Every spring shakes
out the weak. Learn to read between the lines of price action."

================================================================================

🚀 Trade the Structure, Not the Emotion

© 2025 AstroTrade_ | Invite-Only TradingView Script

================================================================================

📚 RECOMMENDED STUDY MATERIALS

📖 Books:
- "Studies in Tape Reading" by Richard D. Wyckoff
- "The Richard D. Wyckoff Method" by Hank Pruden
- "Charting the Stock Market: The Wyckoff Method" by Jack K. Hutson

🎓 Concepts to Master:
- Composite Operator Theory
- Absorption and Distribution
- Volume Spread Analysis (VSA)
- Effort vs. Result Divergence
- Point and Figure Charting
- Cause and Effect Calculations

🔗 Community:
- Study historical accumulation patterns in major indices
- Analyze crypto accumulation zones from past cycles
- Review distribution patterns before major crashes
- Compare your analysis with indicator's automatic detection

💡 Practice Exercises:
1. Mark 10 historical accumulation ranges manually
2. Project targets using cause/effect (compare with TP levels)
3. Identify springs that led to best rallies
4. Find upthrusts that preceded crashes
5. Paper trade for 50+ trades before going live

================================================================================

🙏 ACKNOWLEDGMENTS

This indicator stands on the shoulders of giants:

📊 Richard D. Wyckoff (1873-1934)
→ Pioneer of supply/demand market analysis
→ Creator of the accumulation/distribution framework
→ Founder of modern tape reading

📐 W.D. Gann (1878-1955)
→ Geometric angle theory
→ Square of 9 time cycles
→ Price-time symmetry

🧠 Composite Operator Concept
→ Understanding institutional behavior
→ Reading Smart Money footprints
→ Following the strong hands

This indicator combines Wyckoff's structural analysis with Gann's geometric
projections to create a comprehensive professional trading system.

================================================================================

🎯 YOUR TRADING JOURNEY STARTS HERE

"The goal of the professional trader is simple: BUY from weak hands during
accumulation, SELL to weak hands during distribution, and LET the trend do
the heavy lifting in between."

Master this system. Trust the structure. Trade with confidence.

Welcome to institutional-grade market analysis.

================================================================================

© 2025 AstroTrade_ | Invite-Only TradingView Script

================================================================================