
Trading Truth Index
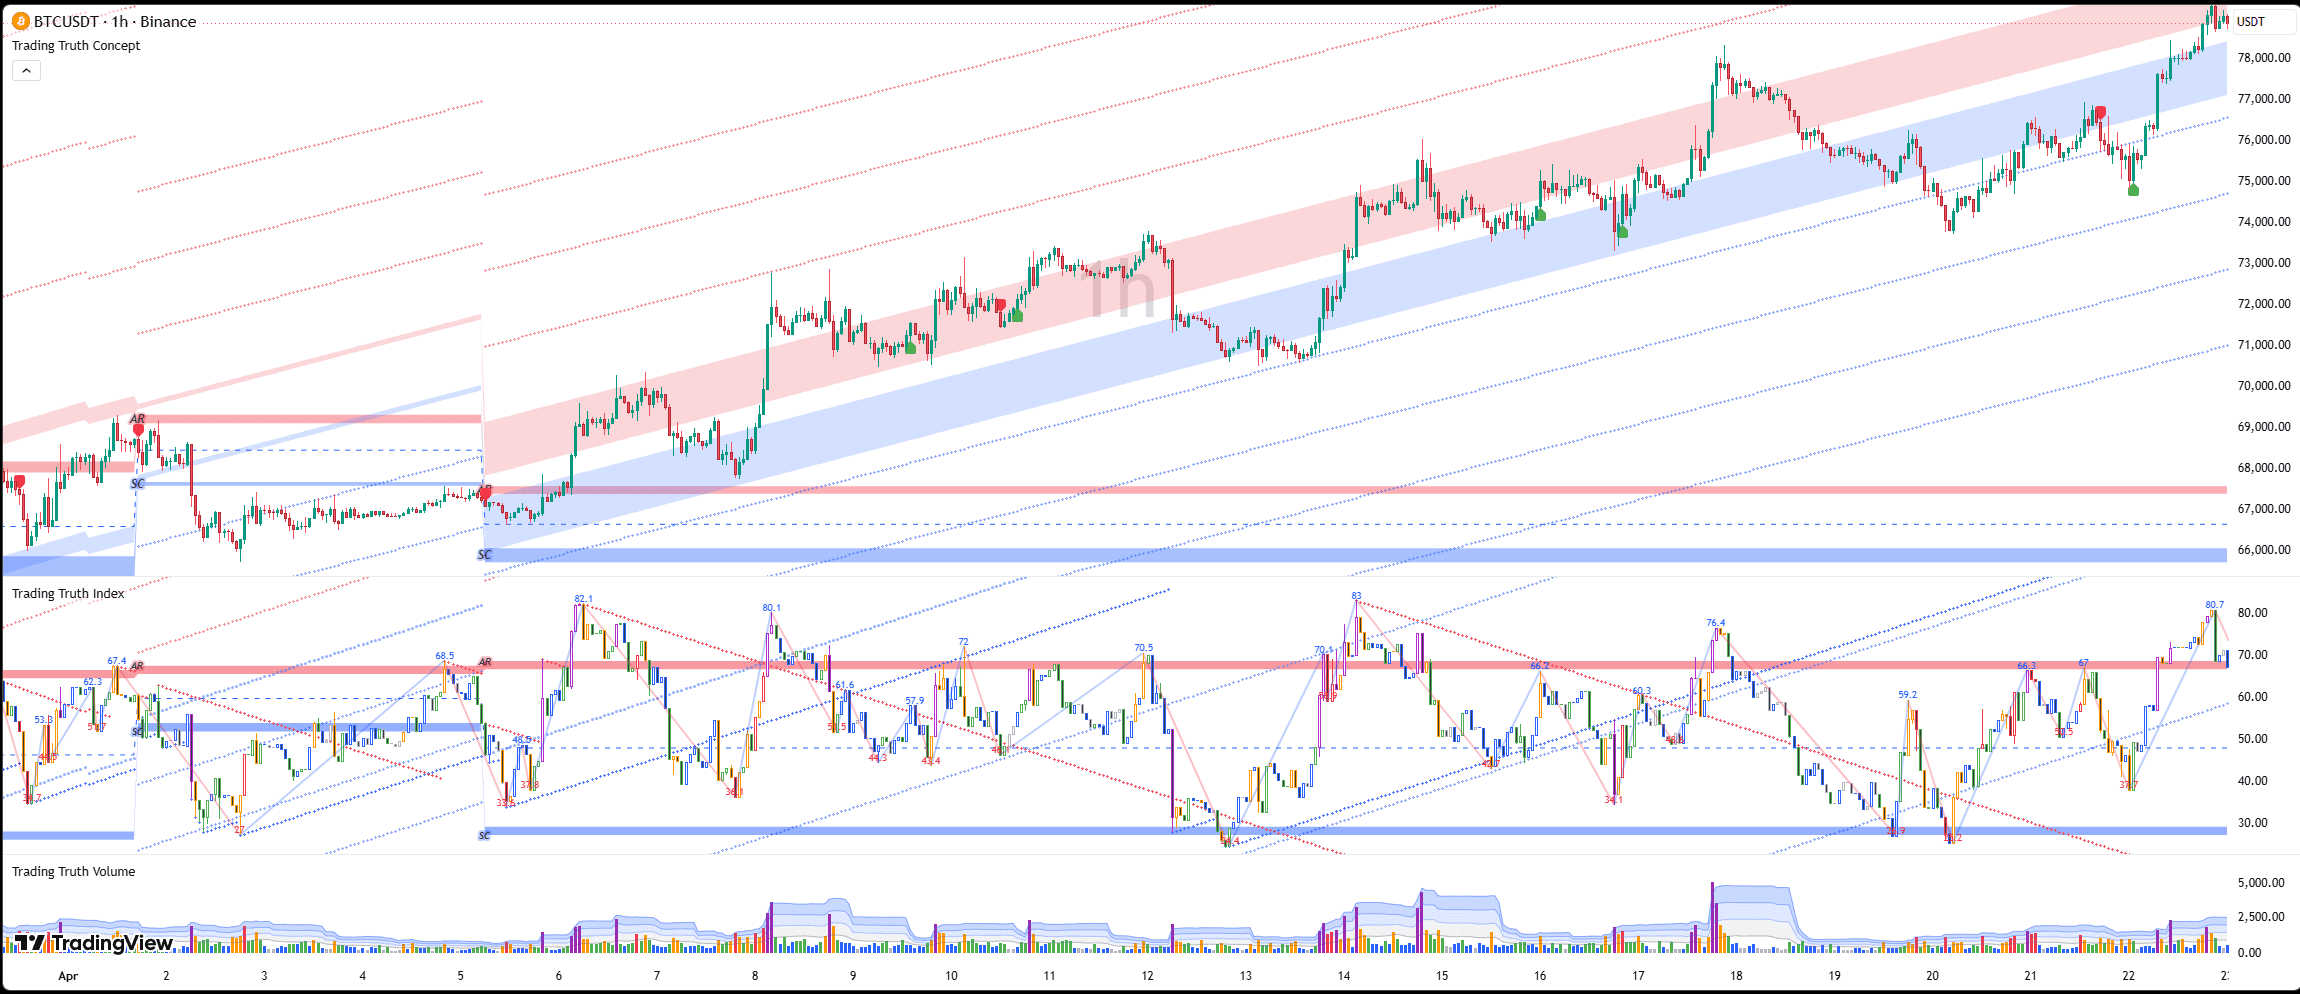
TradingViewWyckoff Method Applied to RSI with Volume-Weighted Waves
Applies classic Wyckoff accumulation and distribution analysis to RSI, revealing hidden demand/supply dynamics that price action alone cannot show.
Markets
Recommended Timeframes
Key Features
- Wyckoff accumulation/distribution detection on real price
- RSI-based visualization and tracking
- Volume-weighted wave system
- Wave zigzag with RSI labels
- Volume heat map on candle wicks
- Automatic HTF detection
- Geometric trendlines from structures
Overview
This indicator applies classic Wyckoff accumulation and distribution analysis to RSI instead of price, revealing hidden demand/supply dynamics that price action alone cannot show. By tracking RSI-based market structure with real price detection, you get the best of both worlds: momentum clarity + precise Wyckoff event identification. The system detects Wyckoff structures on REAL PRICE (springs, upthrusts, etc.) and overlays those events on RSI chart at corresponding RSI values. It tracks volume-weighted waves to confirm institutional activity and projects geometric trendlines from accumulation/distribution phases. Key Wyckoff events detected include: Selling Climax (SC), Automatic Rally (AR), Spring (SP), Test of Spring (TSP), Last Point of Support (LPS), Buying Climax (BC), Upthrust (UT), Test of Upthrust (TUT), and Last Point of Supply (LPSY). The system includes target levels based on Wyckoff's Cause & Effect principle and geometric projections from Wyckoff structures.
Complete Documentation
Full release notes and trading guide
================================================================================
                    📊 RSI WYCKOFF TRADING SYSTEM v1.0
            🔍 Wyckoff Method Applied to RSI with Volume-Weighted Waves
================================================================================

This indicator applies classic Wyckoff accumulation and distribution analysis
to RSI instead of price, revealing hidden demand/supply dynamics that price
action alone cannot show. By tracking RSI-based market structure with real
price detection, you get the best of both worlds: momentum clarity + precise
Wyckoff event identification.

================================================================================
                🧠 THE WYCKOFF METHOD REIMAGINED FOR RSI
================================================================================

                      WHY RSI INSTEAD OF PRICE?

  ✅ Normalized View: RSI (0-100) eliminates price scale differences
  ✅ Early Signals: RSI often diverges before price confirms
  ✅ Cleaner Structure: RSI waves reduce noise vs raw price action
  ✅ Universal Application: Same settings work across all instruments
  ✅ Momentum Context: See strength/weakness beyond just price levels

                      HOW THE SYSTEM WORKS

  1. 🎯 Detect Wyckoff structures on REAL PRICE (springs, upthrusts, etc.)
  2. 📊 Overlay those events on RSI chart at corresponding RSI values
  3. 🌊 Track volume-weighted waves to confirm institutional activity
  4. 📐 Project geometric trendlines from accumulation/distribution phases
  5. 🎪 Display HTF context automatically based on your timeframe

================================================================================
                    🔵 ACCUMULATION PHASE (Demand Building)
================================================================================

Accumulation occurs when professional money absorbs supply at low prices,
creating a base for future uptrends. The system detects this automatically.

--------------------------------------------------------------------------------
                      📍 KEY ACCUMULATION EVENTS
--------------------------------------------------------------------------------

🟦 SC (Selling Climax)
  → Initial panic low where smart money begins buying
  → Detected: d1 swing low = HTF low (real price detection)
  → RSI Display: Blue horizontal line at SC RSI level
  → Volume: Often ultra-high (purple wicks) on the climax

🔴 AR (Automatic Rally)
  → First bounce after SC as selling pressure exhausted
  → Detected: Rally above lower HTF midpoint
  → RSI Display: Red horizontal line at AR RSI level
  → Establishes the upper boundary of accumulation range

🟦 SP (Spring)
  → Price dips below SC, traps sellers, then reverses sharply
  → Detected: Low < SC price, close > SC price (real price logic)
  → Label: "SP" at swing low (blue label pointing up)
  → 🚨 MAJOR SIGNAL: Professional shakeout before markup

🟦 TSP (Test of Spring)
  → Higher low below SC level, confirms spring is holding
  → Detected: Higher low with close back above SC
  → Label: "TSP" (blue label)
  → Confirmation that accumulation is completing

🟦 BU (Backing Up Action)
  → Pullback to AR level that holds as new support
  → Detected: Low < AR, close > AR
  → Label: "BU" (blue label)
  → Shakes out weak hands before final markup

🟦 LPS (Last Point of Support)
  → Final pullback to midpoint before breakout
  → Detected: Low < midpoint, close > midpoint
  → Label: "LPS" (blue label)
  → 🚀 BEST ENTRY: Last chance before trend begins

🔴 UT (Upthrust in Accumulation)
  → False breakout above AR that fails (bearish)
  → Detected: High > AR, close < AR
  → Label: "UT" (red label pointing down)
  → ⚠️ WARNING: Distribution may be starting instead

🔴 BD (Breaking Down Action)
  → Failure to hold above SC (bearish continuation)
  → Detected: High > SC, close < SC
  → Label: "BD" (red label)
  → ⚠️ Accumulation invalidated

🔴 LPSY (Last Point of Supply in Accumulation)
  → Rally fails at midpoint (distribution signal)
  → Detected: High > midpoint, close < midpoint
  → Label: "LPSY" (red label)
  → ⚠️ Sellers still in control

================================================================================
                    🔴 DISTRIBUTION PHASE (Supply Building)
================================================================================

Distribution occurs when professional money offloads positions at high prices,
creating a top for future downtrends. The system detects this automatically.

--------------------------------------------------------------------------------
                      📍 KEY DISTRIBUTION EVENTS
--------------------------------------------------------------------------------

🔴 BC (Buying Climax)
  → Initial euphoric high where smart money begins selling
  → Detected: u1 swing high = HTF high (real price detection)
  → RSI Display: Red horizontal line at BC RSI level
  → Volume: Often ultra-high (purple wicks) on the climax

🟦 AR (Automatic Reaction)
  → First decline after BC as buying pressure exhausted
  → Detected: Decline below upper HTF midpoint
  → RSI Display: Blue horizontal line at AR RSI level
  → Establishes the lower boundary of distribution range

🔴 UT (Upthrust)
  → Price rallies to/above BC, traps buyers, then fails sharply
  → Detected: High >= BC price, close < BC price (real price logic)
  → Label: "UT" at swing high (red label pointing down)
  → 🚨 MAJOR SIGNAL: Professional shakeout before markdown

🔴 TUT (Test of Upthrust)
  → Lower high above BC level, confirms upthrust is holding
  → Detected: Lower high with close back below BC
  → Label: "TUT" (red label)
  → Confirmation that distribution is completing

🔴 BD (Breaking Down Action)
  → Rally above AR that fails as resistance
  → Detected: High > AR, close < AR
  → Label: "BD" (red label)
  → Shakes out bulls before final markdown

🔴 LPSY (Last Point of Supply)
  → Final rally to midpoint that fails
  → Detected: High > midpoint, close < midpoint
  → Label: "LPSY" (red label)
  → 🚀 BEST SHORT ENTRY: Last rally before trend down

🟦 SP (Spring in Distribution)
  → False breakdown below AR that recovers (bullish)
  → Detected: Low < AR, close > AR, new low since HTF high
  → Label: "SP" (blue label pointing up)
  → ⚠️ WARNING: Accumulation may be starting instead

🟦 BU (Backing Up Action in Distribution)
  → Dip below BC that recovers (bullish)
  → Detected: Low < BC, close > BC
  → Label: "BU" (blue label)
  → ⚠️ Distribution invalidated

🟦 ST (Secondary Test)
  → Higher low below AR (bullish continuation)
  → Detected: Low < AR, close > AR, higher than previous low
  → Label: "ST" (blue label)
  → ⚠️ Buyers regaining control

🟦 LPS (Last Point of Support in Distribution)
  → Dip to midpoint holds as support
  → Detected: Low < midpoint, close > midpoint
  → Label: "LPS" (blue label)
  → ⚠️ Accumulation signal

================================================================================
              📐 GEOMETRIC PROJECTIONS FROM WYCKOFF STRUCTURES
================================================================================

Once accumulation or distribution is detected, the system projects dynamic
trendlines to guide future price action.

--------------------------------------------------------------------------------
                  📈 ACCUMULATION TRENDLINES (Bullish)
--------------------------------------------------------------------------------

🔵 ASC 1/1 from SC (Blue Circles)
  → Ascending 1:1 angle from Selling Climax
  → Dynamic support as accumulation progresses
  → Breaks below = caution, accumulation weakening

🔴 ASC 1/1 from AR (Red Crosses)
  → Ascending 1:1 angle from Automatic Rally
  → Resistance turning to support in markup phase
  → Price holding above = strong accumulation

📦 ASC Parallel Lines (Optional)
  → Multiple parallel channels above/below core structure
  → Creates full geometric grid for precision entries
  → Toggle: "📐↗️∥ ASC Parallel Lines"

🟢 HH/LL Since AR (Green Steplines)
  → Tracks highest high and lowest low since AR bar
  → Shows developing range expansion
  → Purple midpoint = key support/resistance

--------------------------------------------------------------------------------
                  📉 DISTRIBUTION TRENDLINES (Bearish)
--------------------------------------------------------------------------------

🔴 DEC 1/1 from BC (Red Circles)
  → Descending 1:1 angle from Buying Climax
  → Dynamic resistance as distribution progresses
  → Breaks above = caution, distribution weakening

🔵 DEC 1/1 from AR (Blue Circles)
  → Descending 1:1 angle from Automatic Reaction
  → Support turning to resistance in markdown phase
  → Price breaking below = strong distribution

📦 DEC Parallel Lines (Optional)
  → Multiple parallel channels above/below core structure
  → Creates full geometric grid for precision shorts
  → Toggle: "📐↘️∥ DEC Parallel Lines"

🔴 HH/LL Since AR (Red Steplines)
  → Tracks highest high and lowest low since AR bar
  → Shows developing range contraction
  → Purple midpoint = key support/resistance

================================================================================
                    🎯 TARGET LEVELS (Cause & Effect)
================================================================================

Wyckoff's Law of Cause & Effect: The size of the accumulation/distribution
range determines the extent of the subsequent move.

--------------------------------------------------------------------------------
                    💚 ACCUMULATION TARGETS (Upside)
--------------------------------------------------------------------------------

  🎯 TP1 (1x Range Above AR)
    → First profit zone = AR + (AR - SC)
    → Conservative exit, high probability
    → Green circles on RSI display

  🎯 TP2 (2x Range Above AR)
    → Mid-range target = AR + 2*(AR - SC)
    → Strong markup phase target
    → Green circles

  🎯 TP3 (3x Range Above AR)
    → Extended target = AR + 3*(AR - SC)
    → Only in strong trending markets
    → Green circles

  📊 Volume Confirmation: Higher targets require sustained volume

--------------------------------------------------------------------------------
                    🔴 DISTRIBUTION TARGETS (Downside)
--------------------------------------------------------------------------------

  🎯 TP1 (1x Range Below AR)
    → First profit zone = AR - (BC - AR)
    → Conservative exit, high probability
    → Blue circles on RSI display

  🎯 TP2 (2x Range Below AR)
    → Mid-range target = AR - 2*(BC - AR)
    → Strong markdown phase target
    → Blue circles

  🎯 TP3 (3x Range Below AR)
    → Extended target = AR - 3*(BC - AR)
    → Only in strong trending markets
    → Blue circles

  📊 Volume Confirmation: Higher targets require sustained volume

================================================================================
              🌊 WAVE VOLUME TRACKING (Institutional Footprints)
================================================================================

The system tracks cumulative volume in each price wave to identify smart money
activity—a key component of Wyckoff analysis.

                      HOW WAVE VOLUME WORKS

  📊 Renko-Based Direction Detection
    → Uses ATR or fixed value to determine wave changes
    → Accumulates volume during each up/down wave
    → Resets when price reverses

  🎯 Wave Confirmation Signals
    → High volume upwaves in accumulation = markup coming
    → High volume downwaves in distribution = markdown coming
    → Low volume waves = counter-trend, likely to fail

  🔢 Volume Scale-Down Factor
    → Adjustable scaling (1, 10, 100, 1000, etc.)
    → Makes volume numbers readable
    → Doesn't affect logic, only display

--------------------------------------------------------------------------------
                        📊 VOLUME HEAT MAP
--------------------------------------------------------------------------------

Candle wick colors reveal volume intensity in real-time:

  💜 Ultra High (2.2x avg)
    → Climax volume—major institutional activity
    → Often marks SC, BC, Springs, Upthrusts

  🔴 Very High (1.8x avg)
    → Strong volume—confirms Wyckoff events
    → Required for valid AR, LPS, LPSY signals

  🟠 High (1.2x avg)
    → Above-average participation
    → Good for trend continuation

  🟢 Normal (0.8-1.2x avg)
    → Healthy trending volume
    → Background activity

  🔵 Low (0.4-0.8x avg)
    → Weak conviction
    → Retracements and consolidation

  ⚪ Very Low (<0.4x avg)
    → Minimal participation
    → Avoid entries on these bars

NOTE: Candle bodies remain black/white for RSI clarity—only wicks colorized.

================================================================================
          ⏱️ HIGHER TIMEFRAME (HTF) AUTO-DETECTION & CONTEXT
================================================================================

The system automatically determines the optimal HTF for structural context
based on your current timeframe.

                      🎯 HTF MAPPING TABLE

  Current TF     →  HTF Context      Purpose
  ──────────────────────────────────────────────────────────────────
  <2 seconds     →  15m              Ultra-scalper anchor
  5 seconds      →  1H               Scalper structural frame
  10 seconds     →  4H               High-frequency context
  15 seconds     →  8H               Minute-level guidance
  30 seconds     →  12H              Sub-minute context
  1 minute       →  1D               Intraday anchor
  5 minutes      →  3D               Swing trader's guide
  15 minutes     →  1W               Position structure
  30 minutes     →  1M               Weekly rhythm
  1 hour         →  1M               Monthly roadmap
  4 hours        →  3M (Q)           Quarterly rhythm
  12 hours       →  12M (Y)          Annual cycle
  Daily          →  12M (Y)          Yearly context
  Weekly         →  12M (Y)          Multi-year view


================================================================================
              🟢 LONG TRADE RULES (Accumulation Playbook)
================================================================================

--------------------------------------------------------------------------------
                  Entry 1: Spring (SP) - Highest Conviction
--------------------------------------------------------------------------------
  Setup: Price dips below SC (Selling Climax), closes back above

  📥 Entry: Close above SC on spring bar or next bar

  🛑 Stop: Below spring low minus 1-2 RSI points

  🎯 TP: LPS → Midpoint → AR → TP1 → TP2 → TP3 (trail)

  📊 Volume: Ultra-high or very high volume required on spring

  ⚡ Confirmation: Look for TSP (Test of Spring) after for best setup

--------------------------------------------------------------------------------
                  Entry 2: Last Point of Support (LPS)
--------------------------------------------------------------------------------
  Setup: Pullback to midpoint holds after AR formed

  📥 Entry: Close above midpoint with bullish RSI candle

  🛑 Stop: Below swing low or SC level

  🎯 TP: AR → TP1 → TP2 (trail)

  📊 Volume: High volume bounce = stronger signal

  ⚡ Best when after spring or TSP already occurred

--------------------------------------------------------------------------------
                  Entry 3: Break of AR (Markup Begins)
--------------------------------------------------------------------------------
  Setup: RSI closes above AR line with volume expansion

  📥 Entry: First close above AR + ascending 1/1 line

  🛑 Stop: Below LPS or midpoint

  🎯 TP: TP1 → TP2 → TP3 (scale out)

  📊 Volume: Very high volume on breakout required

  ⚡ Strongest when RSI > 50 on breakout

--------------------------------------------------------------------------------
                  Entry 4: ASC 1/1 Trendline Bounce
--------------------------------------------------------------------------------
  Setup: RSI pulls back to blue ascending 1/1 line from SC

  📥 Entry: Bounce with bullish candle + volume

  🛑 Stop: Below ascending 1/1 by 2-3 RSI points

  🎯 TP: AR → TP1 targets

  📊 Volume: Decreasing on pullback, increasing on bounce

  ⚡ Geometric continuation pattern

================================================================================
              🔴 SHORT TRADE RULES (Distribution Playbook)
================================================================================

--------------------------------------------------------------------------------
                  Entry 1: Upthrust (UT) - Highest Conviction
--------------------------------------------------------------------------------
  Setup: Price rallies to/above BC (Buying Climax), closes back below

  📤 Entry: Close below BC on upthrust bar or next bar

  🛑 Stop: Above upthrust high plus 1-2 RSI points

  🎯 TP: LPSY → Midpoint → AR → TP1 → TP2 → TP3 (trail)

  📊 Volume: Ultra-high or very high volume required on upthrust

  ⚡ Confirmation: Look for TUT (Test of Upthrust) after for best setup

--------------------------------------------------------------------------------
                  Entry 2: Last Point of Supply (LPSY)
--------------------------------------------------------------------------------
  Setup: Rally to midpoint fails after AR formed

  📤 Entry: Close below midpoint with bearish RSI candle

  🛑 Stop: Above swing high or BC level

  🎯 TP: AR → TP1 → TP2 (trail)

  📊 Volume: High volume rejection = stronger signal

  ⚡ Best when after upthrust or TUT already occurred

--------------------------------------------------------------------------------
                  Entry 3: Break of AR (Markdown Begins)
--------------------------------------------------------------------------------
  Setup: RSI closes below AR line with volume expansion

  📤 Entry: First close below AR + descending 1/1 line

  🛑 Stop: Above LPSY or midpoint

  🎯 TP: TP1 → TP2 → TP3 (scale out)

  📊 Volume: Very high volume on breakdown required

  ⚡ Strongest when RSI < 50 on breakdown

--------------------------------------------------------------------------------
                  Entry 4: DEC 1/1 Trendline Rejection
--------------------------------------------------------------------------------
  Setup: RSI rallies to red descending 1/1 line from BC

  📤 Entry: Rejection with bearish candle + volume

  🛑 Stop: Above descending 1/1 by 2-3 RSI points

  🎯 TP: AR → TP1 targets

  📊 Volume: Decreasing on rally, increasing on rejection

  ⚡ Geometric continuation pattern

================================================================================
                    📊 RSI WAVE ZIGZAG SYSTEM
================================================================================

The indicator plots a wave-based zigzag on RSI using the highest/lowest RSI
values during each price wave, not just close prices.

                      🎨 WAVE VISUALIZATION

  🔵 Blue Lines → Upwaves (developing & confirmed)
    - Shows RSI momentum during bullish price moves
    - Label at top: RSI value at swing high
    - Underscore (_) for developing waves

  🔴 Red Lines → Downwaves (developing & confirmed)
    - Shows RSI momentum during bearish price moves
    - Label at bottom: RSI value at swing low
    - Underscore (_) for developing waves

                      ⚙️ ZIGZAG SETTINGS

  🎨 Show Wave ZigZag (default: ON)
    → Toggle zigzag line display

  🎨 ZigZag Color (default: Black)
    → Customize line color

  📏 Wave Line Size (1-3, default: 2)
    → Adjust line thickness

  🏷️ Show RSI Labels at Swings (default: ON)
    → Display RSI values at each swing point

  🔘 Show Pivot Markers (default: OFF)
    → Add background markers at swings

  📐 Label Size (Tiny/Small/Normal/Large)
    → Adjust label text size

                      💡 TRADING WITH WAVES

  Divergences
    → RSI making higher lows while price makes lower lows = bullish
    → RSI making lower highs while price makes higher highs = bearish

  Wave Momentum
    → Steep RSI waves = strong momentum, expect continuation
    → Shallow RSI waves = weak momentum, expect reversal

  Wyckoff Integration
    → Springs/Upthrusts often show RSI divergence
    → AR/BC levels often align with wave pivots

================================================================================
                      ⚙️ CUSTOMIZATION SETTINGS
================================================================================

--------------------------------------------------------------------------------
                    🔧 RSI CALCULATION SETTINGS
--------------------------------------------------------------------------------

  📊 RSI Length (default: 14)
    → Standard RSI period
    → 7-9 = faster, more signals
    → 21-28 = slower, fewer signals

  📈 OHLC-Based RSI Candles
    → System calculates RSI on Open, High, Low, Close separately
    → Creates RSI "candles" for precise visualization
    → RSI High = highest RSI during real price move
    → RSI Low = lowest RSI during real price move

--------------------------------------------------------------------------------
                    🔵 ACCUMULATION PLOT CONTROLS
--------------------------------------------------------------------------------

  ✅ Enable Accumulation Plots (Master Toggle)
    → Turn all accumulation visuals on/off

  🧱 Accumulation Price Structure (default: ON)
    → Show SC, AR, midpoint lines

  🏷️ Plot Accumulation Labels (default: ON)
    → Display SP, TSP, LPS, BU, UT, BD, LPSY labels

  🎯 Target Levels (default: ON)
    → Show TP1, TP2, TP3 circles above AR

  📐 HTF ASC 1/1 Structure (default: OFF)
    → Show ascending 1:1 geometric trendlines

  📦 Structure Channels (default: OFF)
    → Display ascending/descending channels from HH/LL

  🟢 HH/LL Since AR (default: OFF)
    → Track highest high and lowest low steplines

  📐 ASC Parallel Lines (default: OFF)
    → Extended parallel channel system (advanced)

--------------------------------------------------------------------------------
                    🔴 DISTRIBUTION PLOT CONTROLS
--------------------------------------------------------------------------------

  ✅ Enable Distribution Plots (Master Toggle)
    → Turn all distribution visuals on/off

  🧱 Distribution Price Structure (default: ON)
    → Show BC, AR, midpoint lines

  🏷️ Plot Distribution Event Labels (default: ON)
    → Display UT, TUT, LPSY, BD, SP, BU, ST, LPS labels

  🎯 Target Levels (default: ON)
    → Show TP1, TP2, TP3 circles below AR

  📐 HTF DEC 1/1 Structure (default: OFF)
    → Show descending 1:1 geometric trendlines

  📦 Structure Channels (default: OFF)
    → Display ascending/descending channels from HH/LL

  🔴 HH/LL Since AR (default: OFF)
    → Track highest high and lowest low steplines

  📐 DEC Parallel Lines (default: OFF)
    → Extended parallel channel system (advanced)

--------------------------------------------------------------------------------
                    📈 ZIGZAG & WAVE SETTINGS
--------------------------------------------------------------------------------

  ✅ Show Zigzag Lines (default: ON)
    → Master toggle for wave system

  ✅ Show Wave ZigZag (default: ON)
    → Display connecting lines between swings

  🎨 ZigZag Color (default: Black)
    → Customize wave line color

  📏 Wave Line Size (1-3, default: 2)
    → Adjust thickness

  ✅ Show RSI Labels at Swings (default: ON)
    → Display RSI values at pivots

  ✅ Show Pivot Markers (default: OFF)
    → Background shapes at swing points

  🎨 High Marker Color (default: Gray)
    → Color for swing high backgrounds

  🎨 Low Marker Color (default: Black)
    → Color for swing low backgrounds

  🎨 Up Wave Label Color (default: Blue)
    → Text color for upwave labels

  🎨 Down Wave Label Color (default: Red)
    → Text color for downwave labels

  📐 Label Size (Tiny/Small/Normal/Large)
    → Adjust label text size

--------------------------------------------------------------------------------
                    🌊 WAVE VOLUME SETTINGS
--------------------------------------------------------------------------------

  📊 Renko Assignment Method
    → ATR (default): Dynamic based on volatility
    → Traditional: Fixed price units
    → Part of Price: Percentage-based

  🔢 Value (default: 14)
    → ATR period or fixed value depending on method

  📈 Price Source
    → Close (default): Simplest
    → Open/Close: More responsive
    → High/Low: Most sensitive

  🔻 Volume Scale Down Factor
    → 1, 10, 100, 1000, etc.
    → Makes volume numbers readable
    → Choose based on instrument's typical volume

================================================================================
                      💎 PRO TRADING STRATEGIES
================================================================================

--------------------------------------------------------------------------------
                    🎯 SPRING STRATEGY (Accumulation)
--------------------------------------------------------------------------------

  Best Setup: Spring (SP) → Test of Spring (TSP) → LPS → Breakout

  1. Wait for SC and AR to form (initial structure)
  2. Watch for price to dip below SC with ultra-high volume (Spring)
  3. Confirm with higher low below SC (Test of Spring)
  4. Enter on LPS (Last Point of Support at midpoint)
  5. Scale out at AR, TP1, TP2, TP3

  📊 Volume Profile:
    - Ultra-high on SP
    - Decreasing on TSP
    - Low volume on LPS pullback
    - Expanding volume on breakout above AR

  ⚡ RSI Context:
    - SP often occurs at RSI 30-40
    - LPS at RSI 45-55
    - Breakout above AR when RSI > 50

  🛑 Invalidation:
    - Close below Spring low = failed accumulation
    - LPSY instead of LPS = distribution starting

--------------------------------------------------------------------------------
                    🎯 UPTHRUST STRATEGY (Distribution)
--------------------------------------------------------------------------------

  Best Setup: Upthrust (UT) → Test of Upthrust (TUT) → LPSY → Breakdown

  1. Wait for BC and AR to form (initial structure)
  2. Watch for price to rally above BC with ultra-high volume (Upthrust)
  3. Confirm with lower high above BC (Test of Upthrust)
  4. Enter on LPSY (Last Point of Supply at midpoint)
  5. Scale out at AR, TP1, TP2, TP3

  📊 Volume Profile:
    - Ultra-high on UT
    - Decreasing on TUT
    - Low volume on LPSY rally
    - Expanding volume on breakdown below AR

  ⚡ RSI Context:
    - UT often occurs at RSI 60-70
    - LPSY at RSI 45-55
    - Breakdown below AR when RSI < 50

  🛑 Invalidation:
    - Close above Upthrust high = failed distribution
    - LPS instead of LPSY = accumulation starting

--------------------------------------------------------------------------------
                    🎯 GEOMETRIC CONFLUENCE STRATEGY
--------------------------------------------------------------------------------

  Best Entries: Wyckoff Event + Geometric Trendline + Volume

  Accumulation Example:
    → RSI bounces off ASC 1/1 line at LPS level with high volume
    → Triple confirmation: structure + geometry + volume
    → Highest probability long entry

  Distribution Example:
    → RSI rejects DEC 1/1 line at LPSY level with high volume
    → Triple confirmation: structure + geometry + volume
    → Highest probability short entry

  📐 Advanced: Add HTF context
    - Only long accumulation when HTF also in markup
    - Only short distribution when HTF also in markdown

--------------------------------------------------------------------------------
                    🎯 DIVERGENCE + WYCKOFF STRATEGY
--------------------------------------------------------------------------------

  Bullish Divergence During Accumulation:
    → Price makes lower low, RSI makes higher low
    → Spring or TSP with RSI divergence = strongest setup
    → Often leads to explosive markup phase

  Bearish Divergence During Distribution:
    → Price makes higher high, RSI makes lower high
    → Upthrust or TUT with RSI divergence = strongest setup
    → Often leads to sharp markdown phase

  💡 Pro Tip: Look for divergence specifically at SC/BC retests

--------------------------------------------------------------------------------
                    🎯 MULTI-TIMEFRAME WYCKOFF
--------------------------------------------------------------------------------

  HTF Direction Filter:
    1. Check HTF for accumulation or distribution phase
    2. Only trade current timeframe in same direction as HTF
    3. Example: HTF in accumulation → only long on LTF springs/LPS

  Timeframe Alignment:
    - HTF accumulation + LTF accumulation = highest conviction longs
    - HTF distribution + LTF distribution = highest conviction shorts

  Conflict Resolution:
    - HTF accumulation + LTF distribution = wait or take only LTF shorts
    - HTF distribution + LTF accumulation = wait or take only LTF longs

================================================================================
                    📊 RSI LEVEL INTERPRETATION
================================================================================

                      🎯 RSI ZONES & MEANING

  RSI 80-100 (Extreme Overbought)
    → Climax zone—expect Buying Climax (BC) or Upthrust (UT)
    → Distribution likely forming
    → Not always immediate reversal—can stay elevated in strong trends

  RSI 70-80 (Overbought)
    → Strong momentum, markup phase likely
    → Look for TUT or LPSY if distribution active
    → Breakouts from accumulation often reach here

  RSI 60-70 (Bullish)
    → Healthy uptrend zone
    → AR often forms here in accumulation
    → Good area for trailing stops

  RSI 50-60 (Neutral-Bullish)
    → Midpoint battles—key decision zone
    → LPS often occurs here in accumulation
    → LPSY often fails here in distribution

  RSI 40-50 (Neutral-Bearish)
    → Midpoint battles—key decision zone
    → LPSY often occurs here in distribution
    → LPS often holds here in accumulation

  RSI 30-40 (Bearish)
    → Weak momentum, markdown phase likely
    → AR often forms here in distribution
    → Look for TSP or LPS if accumulation active

  RSI 20-30 (Oversold)
    → Selling pressure extreme
    → SC often occurs here in accumulation
    → Not always immediate bounce—can stay depressed in strong downtrends

  RSI 0-20 (Extreme Oversold)
    → Panic zone—expect Selling Climax (SC) or Spring (SP)
    → Accumulation likely forming
    → Best risk/reward for longs if confirmed

                      🎯 KEY RSI PIVOT LEVELS

  RSI 50 → The Great Divider
    - Above 50 = bulls in control
    - Below 50 = bears in control
    - Accumulation midpoint often near 45-55
    - Distribution midpoint often near 45-55
    - Critical level for trend determination

  RSI 30 & 70 → Traditional Overbought/Oversold
    - Less reliable as absolute signals
    - More useful as "alert zones" for Wyckoff events
    - Wait for structure confirmation, not just level

================================================================================
                    🧠 UNDERSTANDING WYCKOFF LOGIC
================================================================================

                      📚 THE WYCKOFF METHOD PILLARS

  1️⃣ Law of Supply and Demand
    → Prices rise when demand exceeds supply
    → Prices fall when supply exceeds demand
    → Accumulation = demand absorption
    → Distribution = supply offloading

  2️⃣ Law of Cause and Effect
    → Accumulation size = cause
    → Markup extent = effect
    → Larger accumulation → larger markup
    → System measures this with target levels

  3️⃣ Law of Effort vs. Result
    → Effort = volume
    → Result = price movement
    → High volume + small move = absorption/distribution
    → Low volume + big move = lack of interest (suspect move)
    → Springs/Upthrusts are classic effort/result traps

                      🔄 THE WYCKOFF CYCLE

  Phase A: Stopping Action
    → Preliminary Support (PS) → Selling Climax (SC) → Automatic Rally (AR)
    → OR: Preliminary Supply (PS) → Buying Climax (BC) → Automatic Reaction (AR)
    → Trend exhaustion begins

  Phase B: Cause Building
    → Range formation between AR and SC (accumulation)
    → OR: Range formation between BC and AR (distribution)
    → Professional money accumulates/distributes
    → Multiple tests: ST, TSP, LPS, etc.

  Phase C: The Test
    → Spring (accumulation) OR Upthrust (distribution)
    → Shakeout of weak hands
    → Last chance to position before breakout

  Phase D: Trend Transition
    → Sign of Strength (SOS) in accumulation = break above AR
    → Sign of Weakness (SOW) in distribution = break below AR
    → Last Point of Support (LPS) / Last Point of Supply (LPSY)

  Phase E: Trend
    → Markup (accumulation) → reaches TP1, TP2, TP3
    → Markdown (distribution) → reaches TP1, TP2, TP3

                      🎯 WHY THIS APPROACH WORKS

  ✅ RSI Normalization
    - Works on Bitcoin, Gold, EURUSD, SPX with same settings
    - Eliminates price scale bias

  ✅ Real Price Detection
    - Wyckoff events detected on actual price (not RSI price)
    - Prevents false signals from RSI compression

  ✅ Volume Integration
    - Wave volume confirms professional activity
    - Heat map shows institutional footprints

  ✅ Geometric Projection
    - 1:1 angles from structures provide dynamic support/resistance
    - Targets based on cause/effect relationship

  ✅ HTF Context
    - Automatic timeframe alignment prevents counter-trend trades
    - Multi-timeframe confirmation

================================================================================
                        🆘 TROUBLESHOOTING
================================================================================

Q: No accumulation or distribution showing up?
A: - Requires HTF swing to establish first (wait for structure)
   - Need complete wave pattern: SC → AR → Rally above midpoint (accumulation)
   - Or: BC → AR → Decline below midpoint (distribution)
   - May take several bars/candles to detect

Q: Too many labels overlapping?
A: - Disable event labels: turn off "Plot Accumulation/Distribution Labels"
   - Keep structure lines on (SC, AR, BC midpoints)
   - Use larger timeframe for cleaner structure

Q: Zigzag lines not matching price pivots?
A: - Zigzag based on RSI waves, not price candles (expected behavior)
   - RSI can make highs/lows at different times than price
   - This creates divergences—a feature, not a bug

Q: Volume colors not showing?
A: - Check that your data feed includes volume
   - Some instruments (especially forex pairs) have no real volume
   - System will still work, but heat map won't display

Q: Wrong HTF levels?
A: - System auto-detects HTF based on current timeframe
   - Non-standard timeframes may map unexpectedly
   - Use standard TFs: 1m, 5m, 15m, 1H, 4H, 1D for best results

Q: RSI candles look weird?
A: - RSI calculated on OHLC separately (creates candle structure)
   - This is correct—allows precise swing detection
   - "Wicks" on RSI candles show intrabar RSI extremes

Q: Springs/Upthrusts not showing?
A: - Requires price to pierce SC/BC and close back inside (real price logic)
   - Ultra-high or very high volume often needed
   - Not every structure has springs—they're rare shakeouts

Q: Geometric lines extending off-screen?
A: - Disable parallel lines: turn off ASC/DEC Parallel Lines
   - Keep core 1/1 lines only
   - Or use longer lookback period on chart

Q: Different results on different timeframes?
A: - Expected—each timeframe has unique wave structure
   - HTF provides context, LTF provides entries
   - Always check HTF direction before trading LTF

Q: Targets seem too far/too close?
A: - Targets based on structure range (AR - SC or BC - AR)
   - Tight ranges = modest targets
   - Wide ranges = extended targets
   - Adjust position size accordingly

================================================================================
                        📜 VERSION HISTORY
================================================================================

v1.0 (Current - January 2025)
  ✅ Wyckoff accumulation detection on real price
  ✅ Wyckoff distribution detection on real price
  ✅ RSI-based visualization and tracking
  ✅ Volume-weighted wave system with Renko direction logic
  ✅ Wave zigzag with RSI labels at swings
  ✅ Volume heat map on candle wicks (ultra-high to very-low)
  ✅ Automatic HTF detection (sub-second to daily)
  ✅ Market type adjustment (24/7 crypto, 24/5 forex, stock hours)
  ✅ Geometric trendlines from accumulation/distribution structures
  ✅ Target levels based on Wyckoff cause/effect principle
  ✅ Event labeling: SP, TSP, LPS, BU, UT, BD, LPSY, TUT, ST
  ✅ HH/LL tracking since AR for range monitoring
  ✅ Parallel channel system (optional advanced feature)
  ✅ Naked close (_nc) calculations for precision
  ✅ RSI bounds checking (0-100 range enforcement)
  ✅ Full customization of all visual elements
  ✅ Multi-market support (crypto, forex, stocks, futures)

Known Limitations:
  ⚠️ Requires sufficient history to detect first HTF swing
  ⚠️ Very tight ranges may produce overlapping labels
  ⚠️ HTF levels update as swings develop (repainting by design)
  ⚠️ Volume heat map requires volume data (not available on all forex pairs)

Planned v2.0
  🔜 Built-in alert system for all Wyckoff events
  🔜 Phase indicator (A, B, C, D, E display)
  🔜 Composite Operator simulation mode
  🔜 Multi-timeframe panel (show HTF + current TF structure)
  🔜 Enhanced divergence detection with automatic labels
  🔜 Volume profile integration (POC, VAH, VAL)
  🔜 Customizable target multipliers (beyond 1x, 2x, 3x)
  🔜 Re-accumulation and re-distribution detection

================================================================================
                        ⚠️ RISK DISCLAIMER
================================================================================

This indicator is an EDUCATIONAL TOOL based on Wyckoff methodology applied to
RSI. It does NOT guarantee profits. Trading involves substantial risk of loss.

  ⚠️ RSI is a derivative indicator—always confirm with price action
  ⚠️ Wyckoff events are probabilistic, not certain
  ⚠️ Springs and upthrusts can fail—use stops always
  ⚠️ Past accumulation/distribution doesn't guarantee future results
  ⚠️ Volume analysis less reliable on low-liquidity instruments
  ⚠️ HTF structure can change—monitor actively

            MANDATORY RISK MANAGEMENT RULES

  🛑 Always use stop losses (below SP low, above UT high)
  📊 Risk no more than 1-2% of account per trade
  🎯 Scale out at targets—don't aim for home runs every trade
  📈 Combine with price chart—never trade RSI alone
  🧠 Paper trade first until profitable for 20+ trades
  📚 Study original Wyckoff materials for deeper understanding

================================================================================
                        🎓 RECOMMENDED LEARNING PATH
================================================================================

BEGINNER (Week 1-2)
  1. Learn basic Wyckoff cycle: Accumulation → Markup → Distribution → Markdown
  2. Study SC, AR, BC (the core structure points)
  3. Focus on midpoint—most important level
  4. Paper trade only Phase D entries (LPS for longs, LPSY for shorts)
  5. Use only 1x targets initially

INTERMEDIATE (Week 3-6)
  6. Learn to identify Springs and Upthrusts (Phase C)
  7. Add volume heat map to entry criteria (require high+ volume)
  8. Incorporate geometric 1/1 trendlines for confluence
  9. Study divergences at Wyckoff events
  10. Scale into 2x and 3x targets on strong setups

ADVANCED (Month 2-3)
  11. Trade full Wyckoff cycle from Phase A through Phase E
  12. Use multi-timeframe analysis (HTF + LTF alignment)
  13. Combine parallel channels for precision entries
  14. Develop custom strategies for specific market conditions
  15. Trade re-accumulation and re-distribution (after markup/markdown)

MASTERY (Month 4+)
  16. Identify Composite Operator behavior patterns
  17. Anticipate Wyckoff phases before labels appear
  18. Trade both with and against structure based on context
  19. Integrate order flow and institutional volume analysis
  20. Mentor others and refine your unique edge

================================================================================
                    📚 RECOMMENDED READING & RESOURCES
================================================================================

  📖 "Studies in Tape Reading" by Richard D. Wyckoff
    → Foundation of the method

  📖 "The Wyckoff Methodology in Depth" by Rubén Villahermosa
    → Modern comprehensive guide

  📖 "Charting the Stock Market: The Wyckoff Method" by Jack Hutson
    → Practical application

  🎥 Wyckoff Analytics (YouTube Channel)
    → Visual tutorials and examples

  🌐 StockCharts.com Wyckoff Articles
    → Free educational series

  📊 Practice on Multiple Timeframes
    → 1H for learning, 15m for day trading, 1D for swing trading

================================================================================
                    💬 FINAL WORDS FROM THE DEVELOPER
================================================================================

"Wyckoff taught us that the market is not random—it's orchestrated by the
Composite Operator (smart money). By analyzing RSI through the Wyckoff lens,
we see their footprints more clearly than on price alone.

The Spring is not just a low—it's a final shakeout before markup.
The Upthrust is not just a high—it's distribution before markdown.
The midpoint is not just a line—it's the battleground between supply and demand.

Master accumulation, distribution, and the laws of Wyckoff, and you'll see the
market's true intentions before the crowd realizes what's happening.

This is not a holy grail—no indicator is. But combined with discipline, risk
management, and proper education, the RSI Wyckoff system gives you a structural
framework that professional traders use daily.

Trade the structure. Respect the volume. Follow the Composite Operator."

================================================================================

              🚀 Read Wyckoff. Understand RSI. Master Both.

            © 2025 AstroTrade_ | Invite-Only TradingView Script

================================================================================