
Trading Truth Wave
TradingViewAdvanced Wave Volume Analysis & Mean Reversion Channel
Combines Renko-based wave detection with Ehlers filters to identify market waves, measure volume exhaustion, and detect mean reversion opportunities.
Markets
Recommended Timeframes
Key Features
- Renko-based wave detection (ATR/Traditional/Part of Price)
- Wave volume, spread %, and bar count tracking
- Mean Reversion Channel with 7 filter types
- Multi-timeframe analysis (up to 3 timeframes)
- Volume heatmap candle coloring
- ZigZag wave structure visualization
Overview
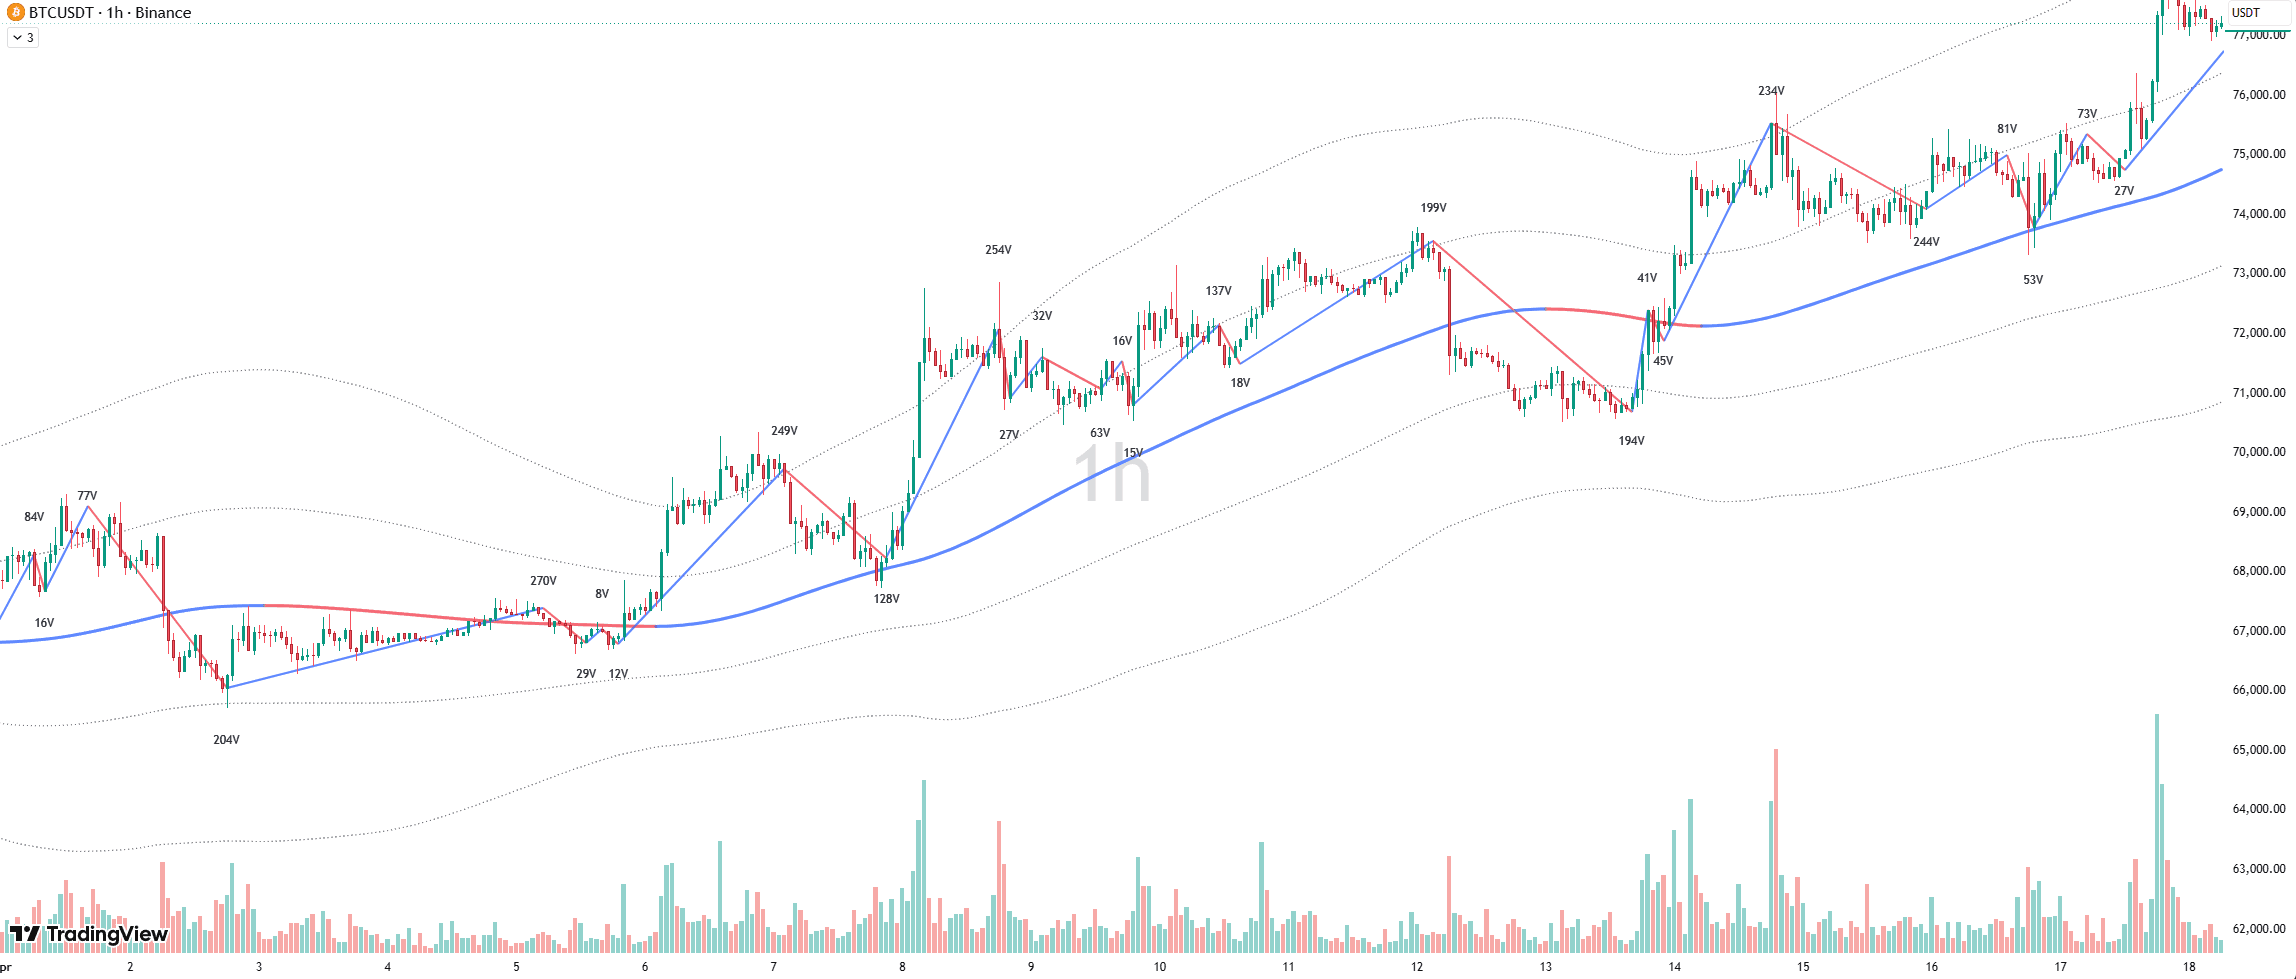
This indicator combines Renko-based wave detection with Ehlers filters to identify market waves, measure volume exhaustion, and detect mean reversion opportunities—delivering precision entries through volume-price-time confluence. The system identifies market waves using adaptive Renko logic, tracking volume, spread (%), and bar count for each wave movement. It features advanced Ehlers-based filter system that creates dynamic support/resistance channels based on market volatility. The Mean Reversion Channel (MRC) includes a mean line (center equilibrium), inner bands (R1/S1), and outer bands (R2/S2) for extreme overbought/oversold zones. The system can display up to 3 timeframes simultaneously for context, and includes a visual zigzag representation of detected waves connecting pivot highs and lows.
Complete Documentation
Full release notes and trading guide
================================================================================
🌊 GEOMETRIC TRADING SYSTEM WAVE v1.0
🎯 Advanced Wave Volume Analysis & Mean Reversion Channel
================================================================================

This indicator combines Renko-based wave detection with Ehlers filters to
identify market waves, measure volume exhaustion, and detect mean reversion
opportunities—delivering precision entries through volume-price-time confluence.

================================================================================
🌊 WAVE DETECTION SYSTEM
================================================================================

The system identifies market waves using adaptive Renko logic, tracking volume,
spread (%), and bar count for each wave movement.

--------------------------------------------------------------------------------
📊 WAVE METRICS DISPLAYED
--------------------------------------------------------------------------------

🔢 WAVE VOLUME
→ Total volume accumulated during the wave
→ Displayed above (upwave) or below (downwave) the pivot
→ Format: "1234V" = 1,234 volume units

📈 WAVE SPREAD (%)
→ Percentage price movement from wave start to end
→ Shows momentum strength
→ Format: "2.5%" = 2.5% price change

⏱️ BAR COUNT
→ Number of bars in the wave
→ Measures time duration
→ Format: "|15" = 15 bars

📏 COMPLETE LABEL FORMAT
→ Upwave: "1234V\n(2.5%|15)" displayed ABOVE bar
→ Downwave: "987V\n(-1.8%|12)" displayed BELOW bar

💡 PRO TIP: Compare consecutive wave volumes to detect supply/demand imbalances.
Large upwave volume followed by small downwave volume = bullish continuation.

================================================================================
⚙️ WAVE CALCULATION METHODS
================================================================================

Choose how waves are calculated based on your trading style:

--------------------------------------------------------------------------------
🎛️ RENKO ASSIGNMENT METHODS
--------------------------------------------------------------------------------

📐 ATR (Recommended)
→ Uses Average True Range for adaptive wave detection
→ Default: 14-period ATR
→ Best for: All market conditions
→ Adjusts to volatility automatically

💰 Traditional
→ Fixed point value (e.g., 10 points = new wave)
→ Best for: Stable instruments like forex majors
→ Requires manual adjustment

📊 Part of Price
→ Divides price by specified value
→ Best for: High-priced instruments (BTC, indices)
→ Scales with price level

--------------------------------------------------------------------------------
📍 PRICE SOURCE OPTIONS
--------------------------------------------------------------------------------

🎯 Close (Recommended)
→ Uses only closing prices
→ Reduces noise, cleaner waves

📊 Open / Close
→ Considers both open and close
→ More sensitive to intrabar movement

📈 High / Low
→ Uses full range (wicks)
→ Most sensitive, more waves

================================================================================
🎨 VOLUME VISUALIZATION (HEATMAP CANDLES)
================================================================================

Optional candle coloring reveals volume intensity at a glance:

--------------------------------------------------------------------------------
🟢 BULLISH VOLUME GRADIENT
--------------------------------------------------------------------------------
🟢 #006700 (Darkest Green) → 2.0x+ average volume (Climax buying)
🟢 #0ca80c → 1.5-2.0x average (Strong buying)
🟢 #44c649 → 1.2-1.5x average (Above average)
🟢 #03f703 → 0.8-1.2x average (Normal)
🟢 #c8e6c9 → 0.4-0.8x average (Weak)
🟢 #dff5df (Lightest Green) → <0.4x average (Very weak)

--------------------------------------------------------------------------------
🔴 BEARISH VOLUME GRADIENT
--------------------------------------------------------------------------------
🔴 #9F0000 (Darkest Red) → 2.0x+ average volume (Capitulation)
🔴 #F30000 → 1.5-2.0x average (Heavy selling)
🔴 #e66161 → 1.2-1.5x average (Above average)
🔴 #f79b9b → 0.8-1.2x average (Normal)
🔴 #f9cdcd → 0.4-0.8x average (Weak)
🔴 #f4e5e5 (Lightest Red) → <0.4x average (Very weak)

🎨 Volume EMA Period: Default 20 bars for comparison baseline

================================================================================
📐 MEAN REVERSION CHANNEL (MRC)
================================================================================

Advanced Ehlers-based filter system that creates dynamic support/resistance
channels based on market volatility.

--------------------------------------------------------------------------------
🔷 MRC COMPONENTS
--------------------------------------------------------------------------------

🎯 MEAN LINE (Center)
→ Primary equilibrium level
→ Blue when trending up, Red when trending down
→ Acts as dynamic support/resistance

📊 INNER BANDS (R1/S1)
→ 1.0x multiplier from mean (default)
→ First overbought/oversold zones
→ Dotted black lines

📊 OUTER BANDS (R2/S2)
→ 2.415x multiplier from mean (default)
→ Extreme overbought/oversold zones
→ Dotted black lines with shaded zones

--------------------------------------------------------------------------------
🎛️ FILTER TYPES AVAILABLE
--------------------------------------------------------------------------------

⚡ SuperSmoother (Recommended)
→ Ehlers SuperSmoother filter
→ Excellent lag vs. smoothing balance
→ Best for: Most trading styles

🌊 Gaussian
→ Smooth response, minimal overshoot
→ Best for: Trend following

🎯 Butterworth
→ Classic engineering filter
→ Best for: Balanced response

🔵 Ehlers EMA
→ Adaptive exponential moving average
→ Best for: Quick response to changes

📉 BandStop
→ Removes specific frequency noise
→ Best for: Choppy markets

📊 Traditional Options
→ SMA, EMA, RMA available for simplicity

💡 Lookback Period: Default 200 bars (adjustable)

================================================================================
🎯 MRC TRADING CONDITIONS (ZONES)
================================================================================

The system automatically identifies where price is relative to the channel:

--------------------------------------------------------------------------------
🟢 BULLISH CONDITIONS
--------------------------------------------------------------------------------

📊 Condition 1: Oversold (Strong) [-3]
→ Price at or below Lower Band 2 extreme
→ High probability bounce zone
→ 🎯 Action: Look for long reversal setups

📊 Condition 2: Oversold [-2]
→ Price between Lower Band 2 and extreme zone
→ Oversold but not extreme
→ 🎯 Action: Prepare for long entries

📊 Condition 3: Oversold (Weak) [-1]
→ Price approaching Lower Band 2 from above
→ Early oversold warning
→ 🎯 Action: Watch for support

📊 Condition 4: Price Below Mean [-5]
→ Price in lower half of channel
→ Bearish bias but not oversold
→ 🎯 Action: Wait for mean reversion

📊 Condition 5: Price Near Mean [-4]
→ Price close to equilibrium from below
→ Neutral zone
→ 🎯 Action: Wait for direction

--------------------------------------------------------------------------------
🔴 BEARISH CONDITIONS
--------------------------------------------------------------------------------

📊 Condition 1: Overbought (Strong) [+3]
→ Price at or above Upper Band 2 extreme
→ High probability rejection zone
→ 🎯 Action: Look for short reversal setups

📊 Condition 2: Overbought [+2]
→ Price between Upper Band 2 and extreme zone
→ Overbought but not extreme
→ 🎯 Action: Prepare for short entries

📊 Condition 3: Overbought (Weak) [+1]
→ Price approaching Upper Band 2 from below
→ Early overbought warning
→ 🎯 Action: Watch for resistance

📊 Condition 4: Price Above Mean [+5]
→ Price in upper half of channel
→ Bullish bias but not overbought
→ 🎯 Action: Hold longs, wait for extension

📊 Condition 5: Price Near Mean [+4]
→ Price close to equilibrium from above
→ Neutral zone
→ 🎯 Action: Wait for direction

================================================================================
🔄 MULTI-TIMEFRAME (MTF) ANALYSIS
================================================================================

The system can display up to 3 timeframes simultaneously for context:

--------------------------------------------------------------------------------
⏱️ AUTO TIMEFRAME MAPPING
--------------------------------------------------------------------------------

Current TF → MTF Level 1 → MTF Level 2
────────────────────────────────────────────────────────
< 1 minute → 1 minute → 5 minutes
1-3 minutes → 5 minutes → 15 minutes
5-10 minutes → 15 minutes → 1 hour
15-30 minutes → 1 hour → 4 hours
1-2 hours → 4 hours → Daily
4-8 hours → Daily → Weekly
Daily → Weekly → Monthly
Weekly+ → Monthly → Quarterly

💡 Custom MTF: Override auto-mapping with your preferred timeframes

--------------------------------------------------------------------------------
🎨 MTF VISUAL ELEMENTS
--------------------------------------------------------------------------------

📈 MTF1 (Lower Timeframe Context)
→ Meanline: Green (uptrend) / Red (downtrend), Width: 5
→ Bands: Red (upper) / Green (lower), Width: 3
→ Optional ZigZag: Blue (up) / Orange (down), Width: 5

📈 MTF2 (Higher Timeframe Context)
→ Meanline: Green (uptrend) / Red (downtrend), Width: 7
→ Bands: Red (upper) / Green (lower), Width: 5
→ Optional ZigZag: Lime (up) / Pink (down), Width: 8

💡 MTF HOVER LABELS: Show detailed stats on hover (optional "Always Display")

================================================================================
🎯 ZIG ZAG LINE (WAVE STRUCTURE)
================================================================================

Visual representation of detected waves connecting pivot highs and lows:

🔵 BLUE LINE (Width: 2)
→ Upwave in progress
→ Connects swing low to current price (rising)

🔴 RED LINE (Width: 2)
→ Downwave in progress
→ Connects swing high to current price (falling)

💡 PRO TIP: When zigzag touches MRC outer bands, expect reversal

================================================================================
🟢 LONG TRADE RULES (WAVE + MRC CONFLUENCE)
================================================================================

--------------------------------------------------------------------------------
Entry 1: Oversold Bounce with Volume Spike
--------------------------------------------------------------------------------
Setup: Price enters Oversold (Strong) zone [-3] at MRC Lower Band 2

Confluence: Large downwave volume followed by small upwave = exhaustion

📥 Entry: Close above mean line with high volume

🛑 Stop: Below recent swing low or Lower Band 2 extreme

🎯 TP: Mean line → Upper Band 1 → Upper Band 2

📊 Volume: Look for decreasing downwave volume (selling exhaustion)

--------------------------------------------------------------------------------
Entry 2: Mean Line Reclaim (Trend Continuation)
--------------------------------------------------------------------------------
Setup: Price pulls back to mean line during uptrend

📥 Entry: Bounce off mean with bullish candle

🛑 Stop: Below mean line or Lower Band 1

🎯 TP: Upper Band 1 (first target) → Upper Band 2 (extended)

📊 Volume: Low volume pullback = healthy correction

📊 Wave Check: Upwave volume > downwave volume = bullish continuation

--------------------------------------------------------------------------------
Entry 3: MTF Alignment Long
--------------------------------------------------------------------------------
Setup: All timeframes show price above their respective mean lines

Confluence: Current TF oversold, MTF1 and MTF2 trending up

📥 Entry: Current TF closes above mean with volume

🛑 Stop: Below current TF Lower Band 1

🎯 TP: Current TF Upper Band 2 or MTF1 mean line

📊 Volume: Ultra-high volume on entry bar preferred

================================================================================
🔴 SHORT TRADE RULES (WAVE + MRC CONFLUENCE)
================================================================================

--------------------------------------------------------------------------------
Entry 1: Overbought Rejection with Volume Spike
--------------------------------------------------------------------------------
Setup: Price enters Overbought (Strong) zone [+3] at MRC Upper Band 2

Confluence: Large upwave volume followed by small downwave = exhaustion

📤 Entry: Close below mean line with high volume

🛑 Stop: Above recent swing high or Upper Band 2 extreme

🎯 TP: Mean line → Lower Band 1 → Lower Band 2

📊 Volume: Look for decreasing upwave volume (buying exhaustion)

--------------------------------------------------------------------------------
Entry 2: Mean Line Breakdown (Trend Reversal)
--------------------------------------------------------------------------------
Setup: Price fails to hold mean line during downtrend

📤 Entry: Rejection from mean with bearish candle

🛑 Stop: Above mean line or Upper Band 1

🎯 TP: Lower Band 1 (first target) → Lower Band 2 (extended)

📊 Volume: Low volume rally = weak bounce

📊 Wave Check: Downwave volume > upwave volume = bearish continuation

--------------------------------------------------------------------------------
Entry 3: MTF Alignment Short
--------------------------------------------------------------------------------
Setup: All timeframes show price below their respective mean lines

Confluence: Current TF overbought, MTF1 and MTF2 trending down

📤 Entry: Current TF closes below mean with volume

🛑 Stop: Above current TF Upper Band 1

🎯 TP: Current TF Lower Band 2 or MTF1 mean line

📊 Volume: Ultra-high volume on entry bar preferred

================================================================================
🎨 WAVE VOLUME ANALYSIS PATTERNS
================================================================================

--------------------------------------------------------------------------------
📊 BULLISH PATTERNS
--------------------------------------------------------------------------------

🟢 BUYING PRESSURE BUILDING
→ Upwave volume increasing over last 3-5 waves
→ Downwave volume decreasing
→ 🎯 Action: Look for long entries on pullbacks

🟢 ABSORPTION
→ Large downwave volume but small price drop (spread %)
→ Next upwave shows strong volume
→ 🎯 Action: Smart money buying into weakness

🟢 SPRING/SHAKEOUT
→ Sharp downwave with ultra-high volume
→ Quick reversal with strong upwave volume
→ 🎯 Action: Stop hunt reversal—enter long immediately

--------------------------------------------------------------------------------
🔴 BEARISH PATTERNS
--------------------------------------------------------------------------------

🔴 SELLING PRESSURE BUILDING
→ Downwave volume increasing over last 3-5 waves
→ Upwave volume decreasing
→ 🎯 Action: Look for short entries on rallies

🔴 DISTRIBUTION
→ Large upwave volume but small price rise (spread %)
→ Next downwave shows strong volume
→ 🎯 Action: Smart money selling into strength

🔴 UPTHRUST
→ Sharp upwave with ultra-high volume
→ Quick reversal with strong downwave volume
→ 🎯 Action: Bull trap—enter short immediately

================================================================================
⚙️ INDICATOR SETTINGS GUIDE
================================================================================

--------------------------------------------------------------------------------
🌊 WAVE SETTINGS
--------------------------------------------------------------------------------

📐 RENKO ASSIGNMENT METHOD
→ ATR: Adaptive to volatility (recommended)
→ Traditional: Fixed point value
→ Part of Price: Percentage-based

🎯 VALUE (DEFAULT: 14)
→ ATR: Number of periods for ATR calculation
→ Traditional: Point value for wave change
→ Part of Price: Divisor (e.g., 100 = 1% waves)

📍 PRICE SOURCE
→ Close: Cleanest waves (recommended)
→ Open/Close: More responsive
→ High/Low: Most sensitive

📊 USE TRUE RANGE
→ Auto: Uses TR when volume unavailable
→ Always: Always uses TR instead of volume
→ Never: Volume only

🎨 WAVE COLORS
→ Upwave Color: Default gray
→ Downwave Color: Default black
→ Customize for your theme

📏 VOLUME DISPLAY
→ Plot Wave Volume: ON/OFF toggle
→ Volume Size: Tiny/Small/Medium/Large/Huge
→ Scale Down Factor: Divide volume by 1/10/100/1000+ for readability

🏷️ MARKERS & LABELS
→ Show Pivot Markers: Arrows at swing points
→ Show Zig Zag: Connect pivots with lines
→ Show Labels: Display wave metrics

🕯️ VOLUME CANDLES
→ Show Volume Candles: Enable heatmap coloring
→ Volume EMA Period: Default 20 bars

--------------------------------------------------------------------------------
📐 MRC SETTINGS
--------------------------------------------------------------------------------

🎯 PRICE SOURCE (DEFAULT: HLC3)
→ HLC3: (High + Low + Close) / 3 (balanced)
→ Close: Most common
→ HL2: (High + Low) / 2

🔷 FILTER TYPE (DEFAULT: SUPERSMOOTHER)
→ SuperSmoother: Best lag/smooth balance
→ Ehlers EMA, Gaussian, Butterworth: Alternatives
→ SMA/EMA/RMA: Traditional options

📏 LOOKBACK PERIOD (DEFAULT: 200)
→ Higher = smoother but more lag
→ Lower = responsive but noisier
→ 100-300 recommended range

📊 INNER CHANNEL MULTIPLIER (DEFAULT: 1.0)
→ Distance from mean to R1/S1
→ Increase for wider channels

📊 OUTER CHANNEL MULTIPLIER (DEFAULT: 2.415)
→ Distance from mean to R2/S2
→ Increase for wider extreme zones

🎨 CHART SETTINGS
→ Draw Channel: Show all bands
→ Draw Zone: Gradient fill between bands
→ Zone Transparency: 0-100 (default 60)
→ Display Line Extension: Extend lines right

--------------------------------------------------------------------------------
🔄 MTF SETTINGS
--------------------------------------------------------------------------------

🔷 ENABLE MTF (DEFAULT: OFF)
→ Enable Multiple TimeFrame Analysis: ON/OFF

🎨 MTF DISPLAY TYPE
→ Always Display: Show all details
→ On Hover: Show details on mouseover only

⏱️ MTF TYPE
→ Auto: System chooses optimal HTF
→ Custom: Manually select MTF1 and MTF2

📊 CUSTOM TIMEFRAMES
→ MTF Level 1: Default Daily
→ MTF Level 2: Default Weekly

🎨 PLOT TOGGLES
→ Enable Original TF Plot: Show current TF MRC
→ Enable MTF1 Plot: Show MTF1 meanline and bands
→ Enable MTF2 Plot: Show MTF2 meanline and bands
→ Enable MTF1 ZigZag Plot: Show MTF1 wave structure
→ Enable MTF2 ZigZag Plot: Show MTF2 wave structure

================================================================================
💎 PRO TRADING STRATEGIES
================================================================================

--------------------------------------------------------------------------------
STRATEGY 1: WAVE VOLUME DIVERGENCE + MRC
--------------------------------------------------------------------------------

📊 SETUP
1. Price makes new low while wave volume decreases (bullish divergence)
2. Price enters MRC Oversold (Strong) zone
3. ZigZag forms swing low at Lower Band 2

📥 ENTRY
→ Close above mean line with volume spike
→ Upwave volume > previous downwave volume

🛑 STOP
→ Below swing low or Lower Band 2 extreme

🎯 TARGET
→ TP1: Mean line (50% off)
→ TP2: Upper Band 1 (25% off)
→ TP3: Trail remainder to Upper Band 2

📊 WIN RATE: 65-75% when all conditions met

--------------------------------------------------------------------------------
STRATEGY 2: MTF TRIPLE ALIGNMENT
--------------------------------------------------------------------------------

📊 SETUP
1. MTF2 trending up (above mean line)
2. MTF1 pulls back to mean line (holds support)
3. Current TF oversold at Lower Band 2

📥 ENTRY
→ Current TF closes above mean with volume
→ All 3 timeframes aligned bullish

🛑 STOP
→ Below current TF swing low

🎯 TARGET
→ TP1: Current TF Upper Band 1
→ TP2: MTF1 mean line
→ TP3: MTF1 Upper Band 1

📊 WIN RATE: 70-80% (high confluence setup)

--------------------------------------------------------------------------------
STRATEGY 3: MEAN LINE REJECTION SCALP
--------------------------------------------------------------------------------

📊 SETUP
1. Strong trend on MTF1 (price far from mean)
2. Current TF pulls back to mean line
3. Low volume on pullback (3-5 wave analysis)

📥 ENTRY
→ Bullish: Bounce off mean with upwave volume increase
→ Bearish: Rejection from mean with downwave volume increase

🛑 STOP
→ 1 ATR beyond mean line

🎯 TARGET
→ TP1: Opposite band (R1 or S1) - 5-10 bars
→ Quick scalp, 1:2 or 1:3 RR

📊 WIN RATE: 60-70% (fast execution required)

================================================================================
🆘 TROUBLESHOOTING
================================================================================

Q: Wave labels not appearing?
A: - Enable "Plot Wave Volume" in settings
- Check "Show Labels" is ON
- Increase "Volume Size" if labels too small
- Reduce "Scale Down Factor" if numbers appear as "0V"

Q: Too many/too few waves?
A: - ATR Method: Increase "Value" (e.g., 14 → 20) for fewer waves
- Traditional Method: Increase point value for fewer waves
- Part of Price: Increase divisor for fewer waves

Q: ZigZag not showing?
A: - Enable "Show Zig Zag" in settings
- Ensure wave detection is working (labels should appear first)

Q: MRC bands not visible?
A: - Enable "Draw Channel" in MRC settings
- Check line transparency isn't set to 100
- Try different filter type (SuperSmoother recommended)

Q: Volume candles not coloring?
A: - Enable "Show Volume Candles" setting
- Check your chart has volume data
- Adjust "Volume EMA Period" (try 10-30 range)

Q: MTF meanlines look wrong?
A: - Check "Enable MTF" is ON
- Verify your current timeframe is supported
- Try "Custom MTF" instead of "Auto"
- Ensure MTF plot toggles are enabled

Q: Wave volumes seem too large/small?
A: - Adjust "Volume Scale Down Factor"
- 1 = no scaling (raw volume)
- 100 = divide by 100 (for crypto)
- 1,000,000 = divide by 1M (for stocks)

Q: Does this work on all markets?
A: - ✅ Crypto: Excellent (24/7, high volume)
- ✅ Forex: Great (use smaller scale down factor)
- ✅ Stocks: Good (check volume data quality)
- ✅ Futures: Great
- ⚠️ Low volume markets: May produce choppy waves

Q: Best timeframes?
A: - Scalping: 1m, 5m (ATR: 7-14)
- Day Trading: 15m, 1H (ATR: 14-20)
- Swing Trading: 4H, 1D (ATR: 20-50)

Q: Repainting issues?
A: - Wave labels update until wave completes (expected)
- Final wave metrics lock after pivot confirmation
- MRC bands don't repaint (calculated on close)
- MTF levels update as swings develop (expected behavior)

================================================================================
📚 ADVANCED CONCEPTS
================================================================================

--------------------------------------------------------------------------------
🧠 WYCKOFF INTEGRATION
--------------------------------------------------------------------------------

The wave volume system aligns perfectly with Wyckoff methodology:

📊 ACCUMULATION (PHASE A-B)
→ Look for: Decreasing downwave volume + increasing upwave volume
→ MRC: Price oscillating around mean line
→ ZigZag: Narrowing range (compression)

📊 MARKUP (PHASE C-D)
→ Look for: Consistently high upwave volume
→ MRC: Price above mean, testing Upper Bands
→ ZigZag: Higher highs, higher lows

📊 DISTRIBUTION (PHASE A-B)
→ Look for: Decreasing upwave volume + increasing downwave volume
→ MRC: Price oscillating around mean line
→ ZigZag: Narrowing range (compression)

📊 MARKDOWN (PHASE C-D)
→ Look for: Consistently high downwave volume
→ MRC: Price below mean, testing Lower Bands
→ ZigZag: Lower lows, lower highs

--------------------------------------------------------------------------------
🔢 EFFORT VS. RESULT ANALYSIS
--------------------------------------------------------------------------------

Compare wave volume (effort) to wave spread % (result):

🟢 BULLISH SCENARIOS
→ High volume + large spread = Healthy trend
→ High volume + small spread = Absorption (buying into weakness)
→ Low volume + large spread = Weak rally (distribution warning)

🔴 BEARISH SCENARIOS
→ High volume + large spread = Healthy downtrend
→ High volume + small spread = Selling climax (potential reversal)
→ Low volume + large spread = Weak selloff (accumulation warning)

--------------------------------------------------------------------------------
📊 BAR COUNT (TIME) ANALYSIS
--------------------------------------------------------------------------------

⏱️ QUICK WAVES (LOW BAR COUNT)
→ Indicates urgency and strong momentum
→ Typical in trend acceleration or reversal initiation

⏱️ SLOW WAVES (HIGH BAR COUNT)
→ Indicates grinding movement or accumulation/distribution
→ Typical in consolidation or late-stage trends

💡 PATTERN: Increasing bar count + decreasing spread % = Exhaustion

================================================================================
📜 VERSION HISTORY
================================================================================

v1.0 (Current - January 2025)
✅ Adaptive Renko-based wave detection (ATR/Traditional/Part of Price)
✅ Wave volume, spread %, and bar count tracking
✅ Mean Reversion Channel with 7 filter types
✅ Multi-timeframe analysis (up to 3 timeframes)
✅ Volume heatmap candle coloring (6-level gradient)
✅ ZigZag wave structure visualization
✅ Pivot markers and labels
✅ MTF meanlines and bands display
✅ MTF ZigZag overlay capability
✅ Customizable channel zones with gradients
✅ Hover labels for MTF statistics

Planned v2.0
🔜 Automated Wyckoff phase detection
🔜 Volume divergence alerts
🔜 MRC extreme zone alerts (Overbought/Oversold)
🔜 Wave volume comparison ratios (auto-calculated)
🔜 Effort vs. Result scoring system
🔜 Multi-wave pattern recognition

================================================================================
🧠 THE SCIENCE BEHIND THE SYSTEM
================================================================================

Combining Volume Price Analysis + DSP

1. Renko Wave Logic
→ Filters noise by requiring minimum price movement
→ ATR adaptation ensures consistency across volatility regimes

2. Volume Tells the Story
→ Price is what you pay, volume is the conviction behind it
→ Large volume waves show institutional participation

3. Ehlers Filters (Digital Signal Processing)
→ Removes market noise while preserving trend information
→ SuperSmoother provides optimal phase lag vs. smoothness

4. Mean Reversion Mathematics
→ Markets oscillate around equilibrium (mean line)
→ Statistical bands define overbought/oversold with precision

5. Multi-Timeframe Context
→ Higher timeframes provide directional bias
→ Lower timeframes provide timing precision
→ Alignment = highest probability setups

WHY THIS WORKS

- Market participants create waves of buying/selling pressure
- Volume reveals the strength behind price movements
- Mean reversion is a statistical certainty over time
- Combining all three (waves + volume + MRC) = edge

================================================================================
⚠️ RISK DISCLAIMER
================================================================================

This indicator is an EDUCATIONAL TOOL for advanced volume price analysis.
It does NOT guarantee profits. Trading involves substantial risk of loss.

- Always use stop losses based on swing structure
- Size positions to risk only 1-2% of account per trade
- Backtest extensively before live trading
- Combine with proper risk management and psychology
- No indicator wins 100% of the time

This system requires practice to master wave interpretation and MRC dynamics.

================================================================================
🎓 LEARNING PATH
================================================================================

WEEK 1: WAVE BASICS
1. Observe waves forming on clean trending markets
2. Note the relationship between volume and spread %
3. Identify when upwave volume > downwave volume (bullish)
4. Practice reading wave labels quickly

WEEK 2: MRC UNDERSTANDING
5. Add MRC to chart (start with SuperSmoother, 200 period)
6. Observe how price respects mean line
7. Note reversals at Outer Bands (R2/S2)
8. Practice identifying the 9 MRC conditions

WEEK 3: COMBINING WAVES + MRC
9. Look for oversold bounces with exhaustion volume
10. Identify mean line rejections during trends
11. Spot absorption patterns at extreme bands
12. Practice entry timing based on confluence

WEEK 4: MTF INTEGRATION
13. Add MTF1 (one timeframe higher)
14. Only trade current TF in direction of MTF1 trend
15. Use MTF1 mean line as first target
16. Add MTF2 for macro context (optional)

MONTH 2+: MASTERY
17. Develop your own wave volume patterns library
18. Create custom strategies for different market conditions
19. Refine entries using bar count and spread % analysis
20. Backtest and forward test with real money (small size)

================================================================================
💬 FINAL WORDS FROM THE ARCHITECT
================================================================================

"Waves are the heartbeat of the market. Volume is the blood pressure. The Mean
Reversion Channel is the EKG showing health. Learn to read all three together,
and you'll know when the market is healthy, exhausted, or about to explode."

Price action alone is incomplete. Volume reveals intent. Waves reveal structure.
The MRC reveals mathematical extremes. Master this trinity, and you'll trade
with clarity in any market condition.

================================================================================

🌊 Trade the Waves, Respect the Volume

© 2025 AstroTrade_ | Invite-Only TradingView Script