
Trading Truth Market Cycles
TradingViewMulti-Timeframe Cycle Analysis & Geometric Projections
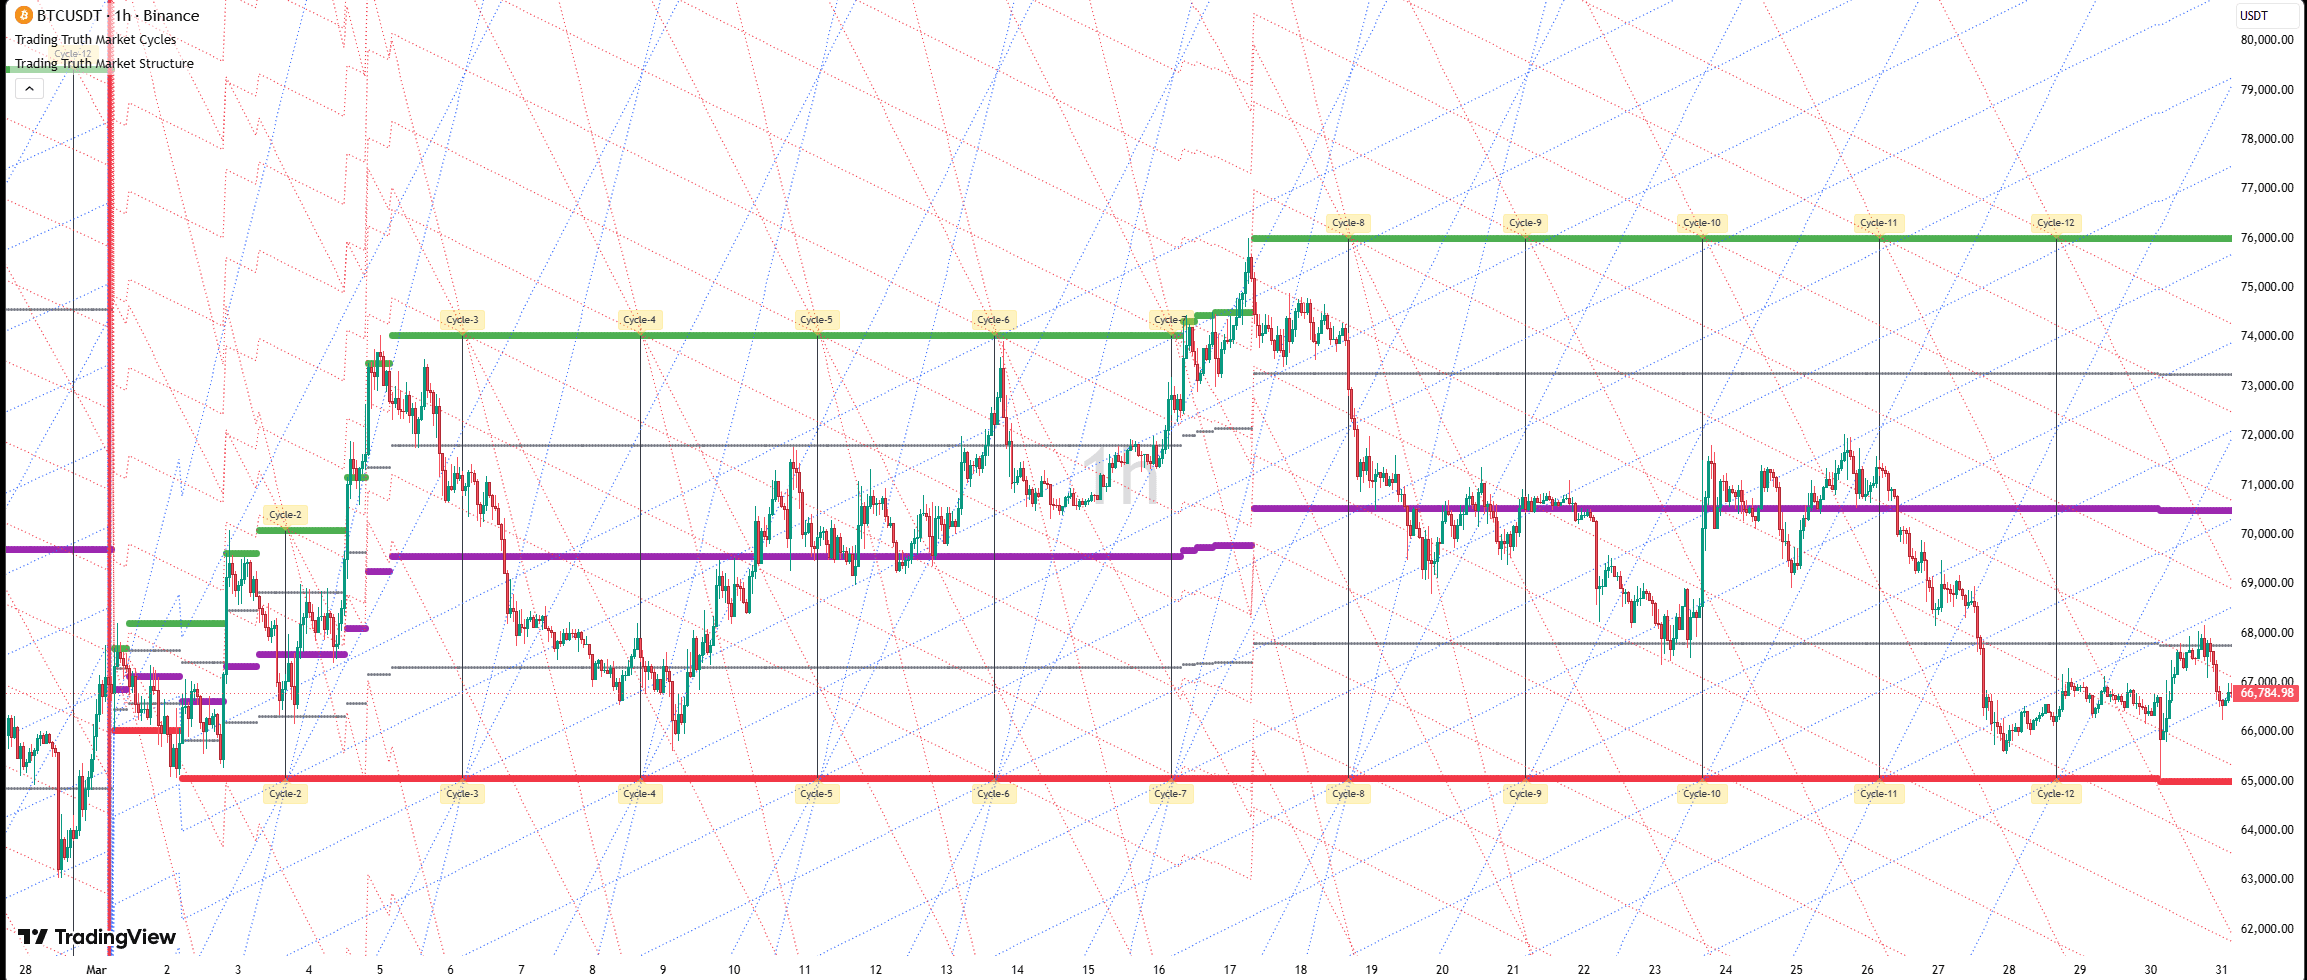
Projects dynamic geometric cycles from HTF swing points, creating a web of trendlines that reveal natural support, resistance, and momentum zones.
Markets
Recommended Timeframes
Key Features
- Multiple ascending/descending cycles per time division
- Cycle-based geometric projections (C1-C12)
- Configurable cycle subdivisions
- Confluence trading at cycle intersections
- Volume integration for cycle confirmation
- Auto HTF detection
Overview
This indicator projects dynamic geometric cycles from higher timeframe (HTF) swing points, creating a web of trendlines that reveal natural support, resistance, and momentum zones throughout each market cycle. Unlike the main Geometric Trading System, this CYCLE version focuses on multiple ascending/descending cycles from each time division, cycle-based geometric projections (C1, C2, C3... C12), configurable cycle subdivisions, and confluence trading at cycle intersections. The system divides each Higher Timeframe period into equal time segments (default: 12 cycles). From the start of each cycle, geometric trendlines are projected forward at various angles. Markets don't move randomly—they flow in rhythmic waves. By dividing time into equal segments and projecting geometry from each segment, we reveal natural turning points, momentum exhaustion zones, geometric support/resistance clusters, and time-price harmony.
Complete Documentation
Full release notes and trading guide
================================================================================
📐 GEOMETRIC TRADING SYSTEM CYCLE v1.0
🌀 Multi-Timeframe Cycle Analysis & Geometric Projections
================================================================================

This indicator projects dynamic geometric cycles from higher timeframe (HTF)
swing points, creating a web of trendlines that reveal natural support,
resistance, and momentum zones throughout each market cycle.

Unlike the main Geometric Trading System, this CYCLE version focuses on:
✅ Multiple ascending/descending cycles from each time division
✅ Cycle-based geometric projections (C1, C2, C3... C12)
✅ Configurable cycle subdivisions (divide HTF into 12 equal parts)
✅ Confluence trading at cycle intersections

================================================================================
🎯 WHAT ARE GEOMETRIC CYCLES?
================================================================================

📊 CYCLE CONCEPT EXPLAINED

The system divides each Higher Timeframe period into equal time segments
(default: 12 cycles). From the start of each cycle, geometric trendlines are
projected forward at various angles.

Think of it like this:
🕐 HTF Period = 1 Day (if you're on 5m chart)
📏 Divided into 12 cycles = New cycle every 2 hours
📐 From each cycle start → Draw 1:1, 4:1, 8:1 angles up and down

🌊 WHY CYCLES MATTER

Markets don't move randomly—they flow in rhythmic waves. By dividing time
into equal segments and projecting geometry from each segment, we reveal:

🎯 Natural turning points (where multiple cycles converge)
🔄 Momentum exhaustion zones (when price crosses many cycles at once)
🧲 Geometric support/resistance clusters (confluence zones)
⏰ Time-price harmony (when angle meets cycle boundary)

================================================================================
🔷 UNDERSTANDING THE CYCLE PLOTS
================================================================================

📈 ASCENDING CYCLE TRENDLINES (BLUE)

These project UPWARD from the HTF low captured at each swing:

📐 1:1 CYCLES (Most Important)
- Balanced angle: 1 unit of price per 1 unit of time
- C1, C2, C3... C12 = Cycles 1 through 12
- Use for trend-following longs
- Break below = momentum shift

⚡ 4:1 CYCLES (Aggressive)
- Steep angle: 4 units of price per 1 unit of time
- Marks rapid accumulation and strong uptrends
- Break = potential exhaustion or pullback zone

🚀 8:1 CYCLES (Extreme)
- Parabolic angle: 8 units of price per 1 unit of time
- Rarely sustained—marks blow-off tops
- Use to identify overbought extremes

📉 DESCENDING CYCLE TRENDLINES (RED)

These project DOWNWARD from the HTF high captured at each swing:

📐 1:1 CYCLES (Most Important)
- Balanced decline: 1 unit down per 1 unit of time
- C1, C2, C3... C12 = Cycles 1 through 12
- Use for trend-following shorts
- Break above = momentum shift

⚡ 4:1 CYCLES (Aggressive)
- Steep decline: 4 units down per 1 unit of time
- Marks rapid distribution and strong downtrends
- Break = potential exhaustion or bounce zone

💀 8:1 CYCLES (Extreme)
- Crash angle: 8 units down per 1 unit of time
- Marks panic selling and capitulation
- Use to identify oversold extremes

================================================================================
⚙️ COMPLETE TRADINGVIEW INPUT GUIDE
================================================================================

🧬 TIME & CYCLES SETTINGS

┌──────────────────────────────────────────────────────────────────┐
│ 🧬 Time & Cycles │
├──────────────────────────────────────────────────────────────────┤
│ ☑ Show Weather Status │
│ → Displays "Cycle-1", "Cycle-2" labels at each cycle start │
│ → Helps identify which cycle you're currently in │
│ │
│ Divide the cycles into equal parts: [12] │
│ → Number of subdivisions per HTF period │
│ → Default: 12 cycles per HTF period │
│ → Lower number (6, 8) = Less lines, broader cycles │
│ → Higher number (16, 24) = More lines, finer precision │
└──────────────────────────────────────────────────────────────────┘

💡 RECOMMENDED CYCLE DIVISIONS:
- Scalping (1m, 5m): 8-12 cycles
- Day Trading (15m, 1H): 12 cycles (default)
- Swing Trading (4H, 1D): 6-8 cycles

--------------------------------------------------------------------------------

🔵📐↗️ ASCENDING CYCLE TRENDS (BULLISH)

┌──────────────────────────────────────────────────────────────────┐
│ 🔵📐↗️ Ascending Cycle Trends │
├──────────────────────────────────────────────────────────────────┤
│ ☑ Enable Ascending Cycle Plots │
│ → MASTER TOGGLE for all ascending cycles │
│ → Turn OFF to hide all blue upward trendlines │
└──────────────────────────────────────────────────────────────────┘

--------------------------------------------------------------------------------

ASC 1/1 PLOTS (1:1 RATIO)

┌──────────────────────────────────────────────────────────────────┐
│ ASC 1/1 Plots │
├──────────────────────────────────────────────────────────────────┤
│ ☐ C1 ☐ C2 ☐ C3 ☐ C4 ☐ C5 ☐ C6 ☐ C7 ☐ C8 │
│ ☐ C9 ☐ C10 ☐ C11 ☐ C12 ☐ Enable All 1/1 │
└──────────────────────────────────────────────────────────────────┘

📌 WHAT EACH CHECKBOX DOES:
C1 = Shows 1:1 ascending line from Cycle 1 start
C2 = Shows 1:1 ascending line from Cycle 2 start
... and so on through C12

☑ Enable All 1/1 = Quick toggle to show ALL twelve 1:1 cycles at once

💡 TRADING STRATEGY:
✅ START WITH: C1, C2, C3 (first 3 cycles)
✅ INTERMEDIATE: Add C4-C6 for mid-cycle analysis
✅ ADVANCED: Enable all 12 to find confluence zones

⚠️ WARNING: Too many lines = cluttered chart
→ Start with just C1 and C2
→ Add more as you learn to read the cycles

--------------------------------------------------------------------------------

ASC 4/1 PLOTS (4:1 RATIO)

┌──────────────────────────────────────────────────────────────────┐
│ ASC 4/1 Plots │
├──────────────────────────────────────────────────────────────────┤
│ ☐ C1 ☐ C2 ☐ C3 ☐ C4 ☐ C5 ☐ C6 ☐ C7 ☐ C8 │
│ ☐ C9 ☐ C10 ☐ C11 ☐ C12 ☐ Enable All 4/1 │
└──────────────────────────────────────────────────────────────────┘

📌 WHAT THIS DOES:
→ Steeper angles (4x the slope of 1:1)
→ Marks aggressive bullish momentum
→ Price reaching these = strong uptrend

💡 USE CASES:
✅ Identifying parabolic moves
✅ Setting aggressive profit targets
✅ Detecting momentum exhaustion (when price can't sustain 4:1)

⚠️ TRADING TIP:
- When price crosses above 4:1 from C1 → VERY bullish
- When price falls back through 4:1 → Momentum slowing
- Confluence of 4:1 cycles = extreme resistance

--------------------------------------------------------------------------------

ASC 8/1 PLOTS (8:1 RATIO)

┌──────────────────────────────────────────────────────────────────┐
│ ASC 8/1 Plots │
├──────────────────────────────────────────────────────────────────┤
│ ☐ C1 ☐ C2 ☐ C3 ☐ C4 ☐ C5 ☐ C6 ☐ C7 ☐ C8 │
│ ☐ Enable All 8/1 │
└──────────────────────────────────────────────────────────────────┘

📌 WHAT THIS DOES:
→ Extremely steep angles (8x the slope of 1:1)
→ Marks parabolic blow-off tops
→ Unsustainable momentum

💡 USE CASES:
✅ Profit-taking zones (extreme overbought)
✅ Short-term reversal areas
✅ Measuring mania phases

⚠️ TRADING TIP:
- Price touching 8:1 from C1 = Take profits on longs
- Multiple 8:1 cycles touched = Exhaustion likely
- Rarely used for entries—mainly for exits

--------------------------------------------------------------------------------

🔴📐↘️ DESCENDING CYCLE TRENDS (BEARISH)

┌──────────────────────────────────────────────────────────────────┐
│ 🔴📐↘️ Descending Cycle Trends │
├──────────────────────────────────────────────────────────────────┤
│ ☑ Enable Descending Cycle Plots │
│ → MASTER TOGGLE for all descending cycles │
│ → Turn OFF to hide all red downward trendlines │
└──────────────────────────────────────────────────────────────────┘

--------------------------------------------------------------------------------

DEC 1/1 PLOTS (1:1 RATIO)

┌──────────────────────────────────────────────────────────────────┐
│ DEC 1/1 Plots │
├──────────────────────────────────────────────────────────────────┤
│ ☐ C1 ☐ C2 ☐ C3 ☐ C4 ☐ C5 ☐ C6 ☐ C7 ☐ C8 │
│ ☐ C9 ☐ C10 ☐ C11 ☐ C12 ☐ Enable All 1/1 │
└──────────────────────────────────────────────────────────────────┘

📌 WHAT EACH CHECKBOX DOES:
C1 = Shows 1:1 descending line from Cycle 1 start
C2 = Shows 1:1 descending line from Cycle 2 start
... and so on through C12

💡 TRADING STRATEGY:
✅ Mirror image of ascending cycles
✅ Use for trend-following shorts
✅ Break above any cycle = bearish momentum weakening

--------------------------------------------------------------------------------

DEC 4/1 PLOTS (4:1 RATIO)

┌──────────────────────────────────────────────────────────────────┐
│ DEC 4/1 Plots │
├──────────────────────────────────────────────────────────────────┤
│ ☐ C1 ☐ C2 ☐ C3 ☐ C4 ☐ C5 ☐ C6 ☐ C7 ☐ C8 │
│ ☐ C9 ☐ C10 ☐ C11 ☐ C12 ☐ Enable All 4/1 │
└──────────────────────────────────────────────────────────────────┘

📌 WHAT THIS DOES:
→ Steep decline (4x the slope of 1:1)
→ Marks aggressive bearish momentum
→ Price falling to these = strong downtrend

💡 USE CASES:
✅ Setting profit targets for shorts
✅ Identifying panic selling zones
✅ Detecting bounce potential (when price bounces off 4:1)

--------------------------------------------------------------------------------

DEC 8/1 PLOTS (8:1 RATIO)

┌──────────────────────────────────────────────────────────────────┐
│ DEC 8/1 Plots │
├──────────────────────────────────────────────────────────────────┤
│ ☐ C1 ☐ C2 ☐ C3 ☐ C4 ☐ C5 ☐ C6 ☐ C7 ☐ C8 │
│ ☐ Enable All 8/1 │
└──────────────────────────────────────────────────────────────────┘

📌 WHAT THIS DOES:
→ Extremely steep decline (8x the slope of 1:1)
→ Marks capitulation and panic selling
→ Unsustainable downward momentum

💡 USE CASES:
✅ Profit-taking zones for shorts (extreme oversold)
✅ Long reversal entries (bounce plays)
✅ Measuring fear/panic phases

⚠️ TRADING TIP:
- Price touching 8:1 from C1 = Cover shorts
- Multiple 8:1 cycles touched = Bounce likely
- Great for counter-trend long entries with tight stops

--------------------------------------------------------------------------------

➡️ EXTEND LINES TO RIGHT

┌──────────────────────────────────────────────────────────────────┐
│ ➡️ Extend Lines │
├──────────────────────────────────────────────────────────────────┤
│ ☐ Extend Lines to the Right │
│ → Projects cycle lines into the future (40-45 bars forward) │
│ → Helps predict upcoming support/resistance zones │
└──────────────────────────────────────────────────────────────────┘

💡 WHEN TO USE:
✅ Planning future entries
✅ Anticipating resistance zones
✅ Setting pending orders at projected angles

⚠️ NOTE: Extended lines are projections, not predictions!

================================================================================
🎯 PRACTICAL SETUP GUIDE (Step-by-Step)
================================================================================

🔰 BEGINNER SETUP (Clean Chart)

Step 1: Enable Master Toggles
☑ Enable Ascending Cycle Plots
☑ Enable Descending Cycle Plots

Step 2: Start with 1:1 Cycles Only
📈 ASC 1/1 Plots: ☑ C1, ☑ C2, ☑ C3
📉 DEC 1/1 Plots: ☑ C1, ☑ C2, ☑ C3

Step 3: Configure Time Settings
☑ Show Weather Status (see cycle labels)
Divide cycles: 12 (default)

Step 4: Disable Line Extensions (cleaner view)
☐ Extend Lines to the Right

RESULT: Clean chart with 6 total lines (3 up, 3 down)

--------------------------------------------------------------------------------

🎓 INTERMEDIATE SETUP (More Context)

Step 1: Keep beginner setup from above

Step 2: Add 4:1 Cycles for Momentum Context
📈 ASC 4/1 Plots: ☑ C1, ☑ C2
📉 DEC 4/1 Plots: ☑ C1, ☑ C2

Step 3: Enable Line Extensions
☑ Extend Lines to the Right

RESULT: 10 total lines showing trend and momentum

--------------------------------------------------------------------------------

🚀 ADVANCED SETUP (Full Arsenal)

Step 1: Enable ALL 1:1 Cycles
📈 ASC 1/1 Plots: ☑ Enable All 1/1
📉 DEC 1/1 Plots: ☑ Enable All 1/1

Step 2: Add 4:1 Cycles (first 4-6)
📈 ASC 4/1 Plots: ☑ C1, ☑ C2, ☑ C3, ☑ C4
📉 DEC 4/1 Plots: ☑ C1, ☑ C2, ☑ C3, ☑ C4

Step 3: Add 8:1 Cycles (first 2-3)
📈 ASC 8/1 Plots: ☑ C1, ☑ C2
📉 DEC 8/1 Plots: ☑ C1, ☑ C2

Step 4: Configure Extensions
☑ Extend Lines to the Right

RESULT: Full geometric web for confluence trading

⚠️ WARNING: This creates ~30+ lines. Only for experienced users!

================================================================================
🎯 CYCLE-BASED TRADING STRATEGIES
================================================================================

📈 STRATEGY 1: SINGLE CYCLE BREAKOUT

Setup:
- Enable ASC 1/1 C1 and DEC 1/1 C1
- Wait for price to cross ABOVE both cycles simultaneously

Entry: Close above BOTH ascending C1 AND descending C1
Stop: Below the cycle intersection point
Target: Next cycle vertical line or previous swing high

Why it works: Breaking both angles = strong momentum shift

--------------------------------------------------------------------------------

🎯 STRATEGY 2: CONFLUENCE ZONE ENTRIES

Setup:
- Enable ASC 1/1: C1, C2, C3
- Look for zones where 2+ cycles cluster together

Entry: Price bounces off confluence zone (2-3 cycles stacked)
Stop: Below the lowest cycle in the cluster
Target: Previous resistance or opposite confluence zone

Why it works: Multiple cycles = strong geometric support

--------------------------------------------------------------------------------

⚡ STRATEGY 3: MOMENTUM EXHAUSTION FADES

Setup:
- Enable ASC 8/1 C1, C2 and/or DEC 8/1 C1, C2
- Wait for price to reach 8:1 extreme angles

Entry: Price touches 8:1 cycle and forms rejection candle
Stop: Beyond the 8:1 line (tight!)
Target: 4:1 or 1:1 cycle below (mean reversion)

Why it works: 8:1 = unsustainable, often reverses

--------------------------------------------------------------------------------

🔄 STRATEGY 4: CYCLE PROGRESSION TRADING

Setup:
- Enable ASC 1/1: C1 through C6
- Watch price progression through cycles

Entry: Price respects and follows cycles sequentially (C1→C2→C3)
Stop: Break below previous cycle
Target: Next cycle up (C4, C5, C6)

Why it works: Sequential cycle respect = strong trend continuation

--------------------------------------------------------------------------------

🌊 STRATEGY 5: CROSS-CYCLE TRADING

Setup:
- Enable ASC 1/1 C1-C4 AND ASC 4/1 C1-C2
- Look for price between 1:1 and 4:1 angles

Entry: Price crosses above 4:1 cycle while holding 1:1 support
Stop: Below 1:1 cycle
Target: 8:1 cycle or previous high

Why it works: Moving from 1:1 to 4:1 = acceleration phase

================================================================================
🎨 VOLUME INTEGRATION (BUILT-IN)
================================================================================

The indicator colors candle WICKS based on volume intensity:

💜 Ultra High (2.2x avg) → Major institutional moves
🔴 Very High (1.8x avg) → Strong volume
🟠 High (1.2x avg) → Above average
🟢 Normal (0.8-1.2x) → Healthy volume
🔵 Low (0.4-0.8x) → Weak volume
⚪ Very Low (<0.4x) → Avoid trading

💡 VOLUME + CYCLES STRATEGY:
✅ Only trade cycle breaks with High/Very High/Ultra High volume
✅ Ignore cycle crosses on Low/Very Low volume
✅ Ultra High volume at cycle confluence = highest conviction trades

================================================================================
📊 HIGHER TIMEFRAME AUTO-DETECTION
================================================================================

The system automatically maps your current timeframe to an optimal HTF:

┌────────────────┬─────────────────┬──────────────────────────────┐
│ Current TF │ HTF Context │ Purpose │
├────────────────┼─────────────────┼──────────────────────────────┤
│ 5 seconds │ 15m │ Ultra-fast scalping │
│ 1 minute │ 1D │ Intraday structure │
│ 5 minutes │ 3D │ Short-term swing context │
│ 15 minutes │ 1W │ Weekly rhythm │
│ 30 minutes │ 1M │ Monthly cycles │
│ 1 hour │ 1M │ Position trading │
│ 4 hours │ 3M (Quarterly) │ Long-term swings │
│ Daily │ 12M (Yearly) │ Investor timeframe │
└────────────────┴─────────────────┴──────────────────────────────┘

🔍 WHAT THIS MEANS:
- HTF periods are divided into your chosen cycle count (default 12)
- Each cycle represents 1/12th of the HTF period
- Example: On 5m chart → HTF = 3 days → 12 cycles = 6 hours per cycle

================================================================================
🧠 CYCLE LABELS & WEATHER STATUS
================================================================================

When "Show Weather Status" is enabled:

┌──────────────────────────────────────────────────────────────────┐
│ │
│ ☀️ Cycle-1 ⛅ Cycle-2 🌤️ Cycle-3 🌥️ Cycle-4 │
│ │
│ Shows at top/bottom of HTF range at each cycle boundary │
│ Yellow labels with black text │
│ │
└──────────────────────────────────────────────────────────────────┘

💡 HOW TO USE CYCLE LABELS:
✅ Quickly identify which cycle period you're in
✅ Anticipate upcoming cycle changes
✅ Confirm your cycle counts match the indicator

📌 CYCLE NUMBERING:
- Resets at each new HTF period
- Cycle-1 = First subdivision after HTF starts
- Cycle-12 = Last subdivision before next HTF period

================================================================================
🎯 CONFLUENCE TRADING MASTERCLASS
================================================================================

🏆 HIGHEST PROBABILITY SETUPS

The BEST trades occur when multiple geometric elements align:

┌──────────────────────────────────────────────────────────────────┐
│ CONFLUENCE CHECKLIST (4+ = Excellent Trade) │
├──────────────────────────────────────────────────────────────────┤
│ ☐ 1. Price crosses 1:1 cycle (C1, C2, or C3) │
│ ☐ 2. Price crosses 4:1 cycle simultaneously │
│ ☐ 3. Volume = High, Very High, or Ultra High │
│ ☐ 4. At or near cycle boundary (vertical time line) │
│ ☐ 5. Multiple cycles converging (2-3 cycles stacked close) │
│ ☐ 6. HTF midpoint cross (from main indicator) │
│ ☐ 7. Rejection wick at previous cycle │
│ ☐ 8. Price momentum (close near high for longs) │
└──────────────────────────────────────────────────────────────────┘

🎯 SCORING SYSTEM:
8 factors = ULTRA RARE monster trade
6-7 factors = Excellent high-probability setup
4-5 factors = Good setup, worth taking
2-3 factors = Marginal, skip unless experienced
0-1 factors = Ignore

--------------------------------------------------------------------------------

📐 EXAMPLE: 6-POINT CONFLUENCE

Imagine price action like this:

Bar 145:
✅ Crosses above ASC 1:1 C2 (Factor 1)
✅ Crosses above DEC 1:1 C2 simultaneously (Factor 2)
✅ Volume = Very High (purple wick) (Factor 3)
✅ Happens at Cycle-3 vertical line boundary (Factor 4)
✅ ASC 1:1 C1 and C2 are within 2% of each other (Factor 5)
✅ Bullish engulfing candle, close near high (Factor 8)

Score: 6/8 → EXCELLENT LONG ENTRY

Entry: Close of bar 145
Stop: Below ASC 1:1 C2 (where we entered)
Target 1: ASC 4:1 C2
Target 2: Previous swing high

--------------------------------------------------------------------------------

🚫 WHAT TO AVOID (Low Quality)

❌ Single cycle cross with Low volume
❌ Cycle cross mid-period (far from cycle boundaries)
❌ Opposing cycle breaks (ASC up, DEC down = conflicting signals)
❌ Extreme 8:1 cycles without rejection candles
❌ No HTF context (trade with higher TF trend)

================================================================================
⚠️ COMMON MISTAKES & FIXES
================================================================================

❌ MISTAKE #1: Too Many Lines Enabled
Problem: Chart is unreadable with 50+ lines
✅ Fix: Start with C1, C2, C3 only (1:1 cycles)

❌ MISTAKE #2: Trading Every Cycle Cross
Problem: Over-trading low-quality signals
✅ Fix: Require 4+ confluence factors

❌ MISTAKE #3: Ignoring Volume
Problem: Taking breaks on low-volume wicks
✅ Fix: Only trade High/Very High/Ultra High volume crosses

❌ MISTAKE #4: No Stop Loss
Problem: One bad trade wipes account
✅ Fix: Always place stop below/above the cycle you entered from

❌ MISTAKE #5: Not Understanding Cycle Numbers
Problem: Confusion about which cycle is which
✅ Fix: Enable "Show Weather Status" to see cycle labels

❌ MISTAKE #6: Using Wrong Timeframe
Problem: Cycles too fast or too slow
✅ Fix: Match your trading style:
- Scalping: 1m, 5m
- Day trading: 15m, 1H
- Swing trading: 4H, 1D

❌ MISTAKE #7: Forgetting HTF Bias
Problem: Taking longs in HTF downtrend
✅ Fix: Use main Geometric System to confirm HTF structure first

================================================================================
🎓 LEARNING PROGRESSION PATH
================================================================================

WEEK 1: BASICS
┌──────────────────────────────────────────────────────────────────┐
│ Goals: │
│ - Understand what cycles are │
│ - Learn to enable/disable plots │
│ - Identify cycle labels on chart │
│ │
│ Setup: │
│ ☑ ASC 1/1: C1, C2 │
│ ☑ DEC 1/1: C1, C2 │
│ ☑ Show Weather Status │
│ │
│ Assignment: │
│ → Watch 50 cycle crosses (don't trade) │
│ → Note which ones led to big moves │
│ → Look for patterns in successful vs failed crosses │
└──────────────────────────────────────────────────────────────────┘

WEEK 2: VOLUME INTEGRATION
┌──────────────────────────────────────────────────────────────────┐
│ Goals: │
│ - Correlate volume colors with cycle crosses │
│ - Distinguish high-quality from low-quality setups │
│ │
│ Setup: │
│ ☑ ASC 1/1: C1, C2, C3 │
│ ☑ DEC 1/1: C1, C2, C3 │
│ │
│ Assignment: │
│ → Only mark crosses with High+ volume │
│ → Measure win rate: High vol vs Low vol crosses │
│ → Create a log of your observations │
└──────────────────────────────────────────────────────────────────┘

WEEK 3: CONFLUENCE HUNTING
┌──────────────────────────────────────────────────────────────────┐
│ Goals: │
│ - Identify multi-cycle confluence zones │
│ - Learn to score setups (4+ factors) │
│ │
│ Setup: │
│ ☑ ASC 1/1: Enable All 1/1 │
│ ☑ DEC 1/1: Enable All 1/1 │
│ │
│ Assignment: │
│ → Find 20 examples of 2+ cycles converging │
│ → Note which confluence zones held vs broke │
│ → Begin paper trading best setups │
└──────────────────────────────────────────────────────────────────┘

WEEK 4: MOMENTUM LAYERS
┌──────────────────────────────────────────────────────────────────┐
│ Goals: │
│ - Add 4:1 and 8:1 cycles │
│ - Understand momentum acceleration/exhaustion │
│ │
│ Setup: │
│ ☑ ASC 1/1: C1-C6 │
│ ☑ ASC 4/1: C1-C3 │
│ ☑ DEC 1/1: C1-C6 │
│ ☑ DEC 4/1: C1-C3 │
│ │
│ Assignment: │
│ → Study transitions from 1:1 to 4:1 (acceleration) │
│ → Study failures at 8:1 (exhaustion) │
│ → Paper trade with full setup │
└──────────────────────────────────────────────────────────────────┘

MONTH 2+: MASTERY
┌──────────────────────────────────────────────────────────────────┐
│ Goals: │
│ - Live trade with proper risk (1-2% per trade) │
│ - Develop personal style within geometric framework │
│ - Combine with other indicators (RSI, order flow, etc.) │
│ │
│ Assignment: │
│ → Track 100+ live trades │
│ → Calculate edge: Win rate, Risk/Reward, Expectancy │
│ → Refine entry/exit rules based on data │
│ → Teach concept to someone else (test understanding) │
└──────────────────────────────────────────────────────────────────┘

================================================================================
🔬 ADVANCED: CYCLE DIVERGENCE
================================================================================

🎯 CONCEPT: CYCLE INVALIDATION

When price breaks through a cycle it should respect, it signals:
- Momentum shift
- Potential reversal
- False breakout if it fails to hold

📊 DIVERGENCE TYPES

1️⃣ BULLISH DIVERGENCE
Price: Making lower lows
Cycles: Price holding ABOVE ascending 1:1 cycles
Signal: Downtrend weakening, watch for reversal

2️⃣ BEARISH DIVERGENCE
Price: Making higher highs
Cycles: Price failing BELOW descending 1:1 cycles
Signal: Uptrend weakening, watch for reversal

3️⃣ MOMENTUM DIVERGENCE
Price: New high
Cycles: Fails to reach 4:1 or 8:1 (only hits 1:1)
Signal: Momentum slowing, consolidation coming

🎯 HOW TO TRADE DIVERGENCE

Setup: Spot divergence between price and cycle behavior
Confirm: Wait for price to break counter-trend cycle
Entry: Break + volume confirmation
Stop: Beyond recent swing
Target: Opposite cycles or HTF level

================================================================================
📈 MULTI-TIMEFRAME ANALYSIS
================================================================================

🔍 THE POWER OF CONTEXT

Combine Cycle indicator on multiple timeframes:

Primary Chart (Trade Execution):
→ 5m or 15m with cycles enabled
→ This is where you take entries

Context Chart (Bigger Picture):
→ 1H or 4H with cycles enabled
→ Confirms higher timeframe trend direction

Filter Rule:
✅ Only take longs when 1H cycles are ascending
✅ Only take shorts when 1H cycles are descending
❌ Don't fight the higher timeframe cycles

Example:
1H Chart: Price above ASC 1:1 C1 (bullish HTF)
5m Chart: Price crosses above ASC 1:1 C2 (bullish entry)
→ TAKE THE LONG (aligned)

1H Chart: Price below DEC 1:1 C1 (bearish HTF)
5m Chart: Price crosses above ASC 1:1 C2 (bullish entry)
→ SKIP THE LONG (conflicting)

================================================================================
🆘 TROUBLESHOOTING & FAQ
================================================================================

❓ Q: Lines aren't showing up?
✅ A: Check these in order:
1. Is "Enable Ascending/Descending Cycle Plots" turned ON?
2. Have you selected at least one C1-C12 checkbox?
3. Try refreshing the chart (F5)
4. Check you're on a supported timeframe

❓ Q: Too many lines, chart is cluttered?
✅ A: Reduce your setup:
1. Disable 4:1 and 8:1 cycles
2. Only enable C1, C2, C3 for 1:1 cycles
3. Uncheck "Extend Lines to the Right"
4. Reduce "Divide cycles" from 12 to 8 or 6

❓ Q: Cycle labels not appearing?
✅ A: Check "Show Weather Status" is enabled (☑)

❓ Q: Which cycles should I enable for day trading?
✅ A: Recommended for day trading (15m, 1H charts):
- ASC 1/1: C1, C2, C3, C4
- DEC 1/1: C1, C2, C3, C4
- ASC 4/1: C1, C2 (optional)
- DEC 4/1: C1, C2 (optional)

❓ Q: Do cycles repaint?
✅ A: The HTF high/low capture points update as swings develop, which causes
cycles to "shift" until a swing is confirmed. This is normal and
expected. Once a swing is confirmed (new swing in opposite direction
forms), the previous swing's cycles are locked.

❓ Q: Can I use this without the main Geometric Trading System?
✅ A: Yes, but it's recommended to use both:
- Main system: Provides HTF structure (midpoint, HH/LL)
- Cycle system: Provides precise entry timing within structure

❓ Q: What's the difference between C1 and C12?
✅ A:
- C1 = Cycle 1, starts at beginning of HTF period
- C12 = Cycle 12, starts near end of HTF period (if 12 divisions)
- Early cycles (C1-C3) often more reliable
- Late cycles (C10-C12) near HTF boundary, more reversals

❓ Q: When should I use 8:1 vs 1:1 cycles?
✅ A:
- 1:1 = Primary trend following, most trades here
- 4:1 = Momentum confirmation, aggressive targets
- 8:1 = Exhaustion/reversal signals, profit taking zones
- Use 1:1 for 80% of trades, others for context

❓ Q: How do I know which cycle to trade?
✅ A: Look for:
1. Cycles near current price (most relevant)
2. Recent cycle that's been respected (support/resistance)
3. Multiple cycles converging (confluence)
4. Early-to-mid cycles (C1-C6 more reliable than C7-C12)

❓ Q: Can I combine this with other indicators?
✅ A: Absolutely! Great combinations:
- RSI: Confluence of cycle + RSI divergence
- MACD: Cycle cross + MACD cross = strong signal
- Volume Profile: Cycles near volume nodes = support/resistance
- Order Flow: Cycles + absorption/exhaustion = reversals

❓ Q: What markets work best with cycles?
✅ A:
✅ Crypto (24/7) - Excellent, clean cycles
✅ Forex (24/5) - Very good, adjust for weekend gaps
✅ Indices (Futures) - Excellent, strong trends
✅ Stocks - Good, watch for earnings/news gaps
⚠️ Low-volume altcoins - Poor, erratic

❓ Q: How many bars of history needed?
✅ A: Minimum 1 full HTF period for cycles to initialize
- 5m chart: Need 3+ days of data
- 1H chart: Need 1+ month of data
- 1D chart: Need 12+ months of data

================================================================================
💎 PRO TIPS & HIDDEN GEMS
================================================================================

🎯 TIP #1: THE "CYCLE SANDWICH"
When price is between two cycles (above ASC C1, below ASC C2), it's in
a geometric channel. Trade the range until breakout.

🎯 TIP #2: CYCLE REJECTION = SIGNAL
When price touches a cycle and immediately reverses with high volume,
that's a rejection. Trade the opposite direction.

🎯 TIP #3: CYCLE CLUSTERING
When 3+ cycles converge within 1-2% of price, it's a MEGA support/
resistance. These rarely break on first test.

🎯 TIP #4: THE "CYCLE LADDER"
In strong trends, price climbs from C1 → C2 → C3 → C4 sequentially.
If it skips a cycle (jumps from C1 to C3), momentum is extreme.

🎯 TIP #5: CYCLE TIMING
Reversals often occur at cycle boundaries (when new cycle starts).
Combine with cycle vertical lines for precise timing.

🎯 TIP #6: HIDDEN DIVERGENCE
If price makes new high but fails to reach C2 (only touches C1),
it's showing hidden weakness. Watch for reversal.

🎯 TIP #7: VOLATILITY EXPANSION
When price crosses from 1:1 to 4:1 to 8:1 rapidly, volatility is
expanding. Expect quick moves and potential reversal at 8:1.

🎯 TIP #8: THE "CYCLE RETEST"
After breaking a cycle, price often retests it from the other side.
This retest is a high-probability entry (failed support = resistance).

🎯 TIP #9: ASYMMETRIC CYCLES
If ascending cycles are compressed (close together) and descending
are spread out, it signals bullish bias. Vice versa for bearish.

🎯 TIP #10: CYCLE + FIBONACCI
Cycles often align with Fibonacci levels (0.618, 1.618, etc.).
When they converge, it's an ultra-high probability zone.

================================================================================
📊 SAMPLE TRADE EXAMPLES
================================================================================

🟢 EXAMPLE 1: CLEAN CYCLE BREAKOUT

Chart: BTC/USD, 15-minute
Setup:
- Price consolidating between ASC 1:1 C1 and C2
- Sitting at Cycle-3 vertical line boundary
- Volume declining (consolidation)

Trigger:
- Bar 248: Price closes above BOTH ASC 1:1 C2 AND DEC 1:1 C2
- Volume spike to Very High (red wick)
- Bullish engulfing candle

Entry: $43,250 (close of bar 248)
Stop: $43,100 (below ASC 1:1 C2)
Target 1: $43,500 (ASC 4:1 C2) → HIT in 12 bars
Target 2: $43,750 (previous high) → HIT in 28 bars

Outcome: +1.15% and +2.3% (scaled out)
Risk/Reward: 1:3.3

Confluence Factors: 7/8
✅ Crossed ASC 1:1 C2
✅ Crossed DEC 1:1 C2 simultaneously
✅ Very High volume
✅ At cycle boundary (C3)
✅ C1 and C2 converging (confluence)
✅ Engulfing candle
✅ Close near high

--------------------------------------------------------------------------------

🔴 EXAMPLE 2: MOMENTUM EXHAUSTION SHORT

Chart: ETH/USD, 1-hour
Setup:
- Price in strong uptrend, hitting ASC 8:1 C1
- Parabolic move over 8 hours
- Very High volume throughout rally

Trigger:
- Bar 89: Price touches ASC 8:1 C1 at $2,850
- Forms shooting star (rejection candle)
- Ultra High volume (purple wick)
- Fails to close above 8:1 line

Entry: $2,820 (close of bar 89, below 8:1)
Stop: $2,870 (above 8:1 line)
Target 1: $2,750 (ASC 4:1 C1) → HIT in 6 bars
Target 2: $2,680 (ASC 1:1 C1) → HIT in 14 bars

Outcome: -2.48% and -4.96% (scaled out)
Risk/Reward: 1:4.2

Confluence Factors: 6/8
✅ Touched 8:1 extreme (exhaustion)
✅ Rejection candle (shooting star)
✅ Ultra High volume
✅ Failed close above 8:1
✅ Momentum divergence (RSI not confirming)
✅ Near cycle boundary (C1 ending)

--------------------------------------------------------------------------------

🟢 EXAMPLE 3: CONFLUENCE ZONE BOUNCE

Chart: SPY, 5-minute
Setup:
- Price pulling back in uptrend
- Three cycles converging: ASC 1:1 C2, C3, C4 within 0.5%
- Volume decreasing on pullback (healthy)

Trigger:
- Bar 312: Price hits confluence zone ($480.50)
- Forms hammer candle (bullish reversal)
- Volume spikes to High (orange wick)
- Closes above all three cycles

Entry: $480.75 (close of bar 312)
Stop: $480.30 (below confluence zone)
Target 1: $481.50 (ASC 4:1 C2) → HIT in 9 bars
Target 2: $482.25 (previous high) → HIT in 22 bars

Outcome: +0.94% and +1.87%
Risk/Reward: 1:3.3

Confluence Factors: 6/8
✅ Three cycles converging (mega support)
✅ Hammer reversal candle
✅ High volume on bounce
✅ Held above all three 1:1 cycles
✅ Volume divergence (declining on pullback)
✅ HTF uptrend context

================================================================================
🎯 FINAL WORDS & PHILOSOPHY
================================================================================

"The market breathes in cycles. Each cycle is a heartbeat—a rhythm of
accumulation and distribution, expansion and contraction. By mapping these
geometric cycles, we're not predicting the future; we're listening to the
market's natural pulse and trading in harmony with it."

🌊 THE CYCLE MINDSET

Markets don't move randomly—they flow through repeating patterns:
1. Accumulation (early cycles)
2. Markup (mid cycles)
3. Distribution (late cycles)
4. Markdown (reversal to next HTF)

Your job as a cycle trader:
✅ Identify which phase you're in
✅ Trade with the geometric flow
✅ Exit before the cycle breaks

📐 THE GEOMETRIC TRUTH

Price seeks balance. The 1:1 angle represents equilibrium between bulls
and bears. When price deviates (4:1, 8:1), it must eventually return to
balance. Trade these extremes, but always respect the geometric center.

⏰ TIME IS PRICE

Gann's greatest insight: Time and price are equally important. A cycle
boundary is not just a temporal marker—it's an energy node where reversals
become high probability. Respect time as much as you respect price.

🎯 MASTER THE BASICS FIRST

Don't try to use every feature immediately:
Week 1-2: Just 1:1 cycles (C1, C2, C3)
Week 3-4: Add confluence and volume
Month 2: Introduce 4:1 momentum layers
Month 3+: Full geometric web

Complexity without mastery leads to confusion. Start simple, build gradually.

================================================================================

🚀 Trade the Cycles, Respect the Geometry


© 2025 AstroTrade_ | Invite-Only TradingView Script

================================================================================