
Gann-Inspired Angular Momentum & Cycle Detector
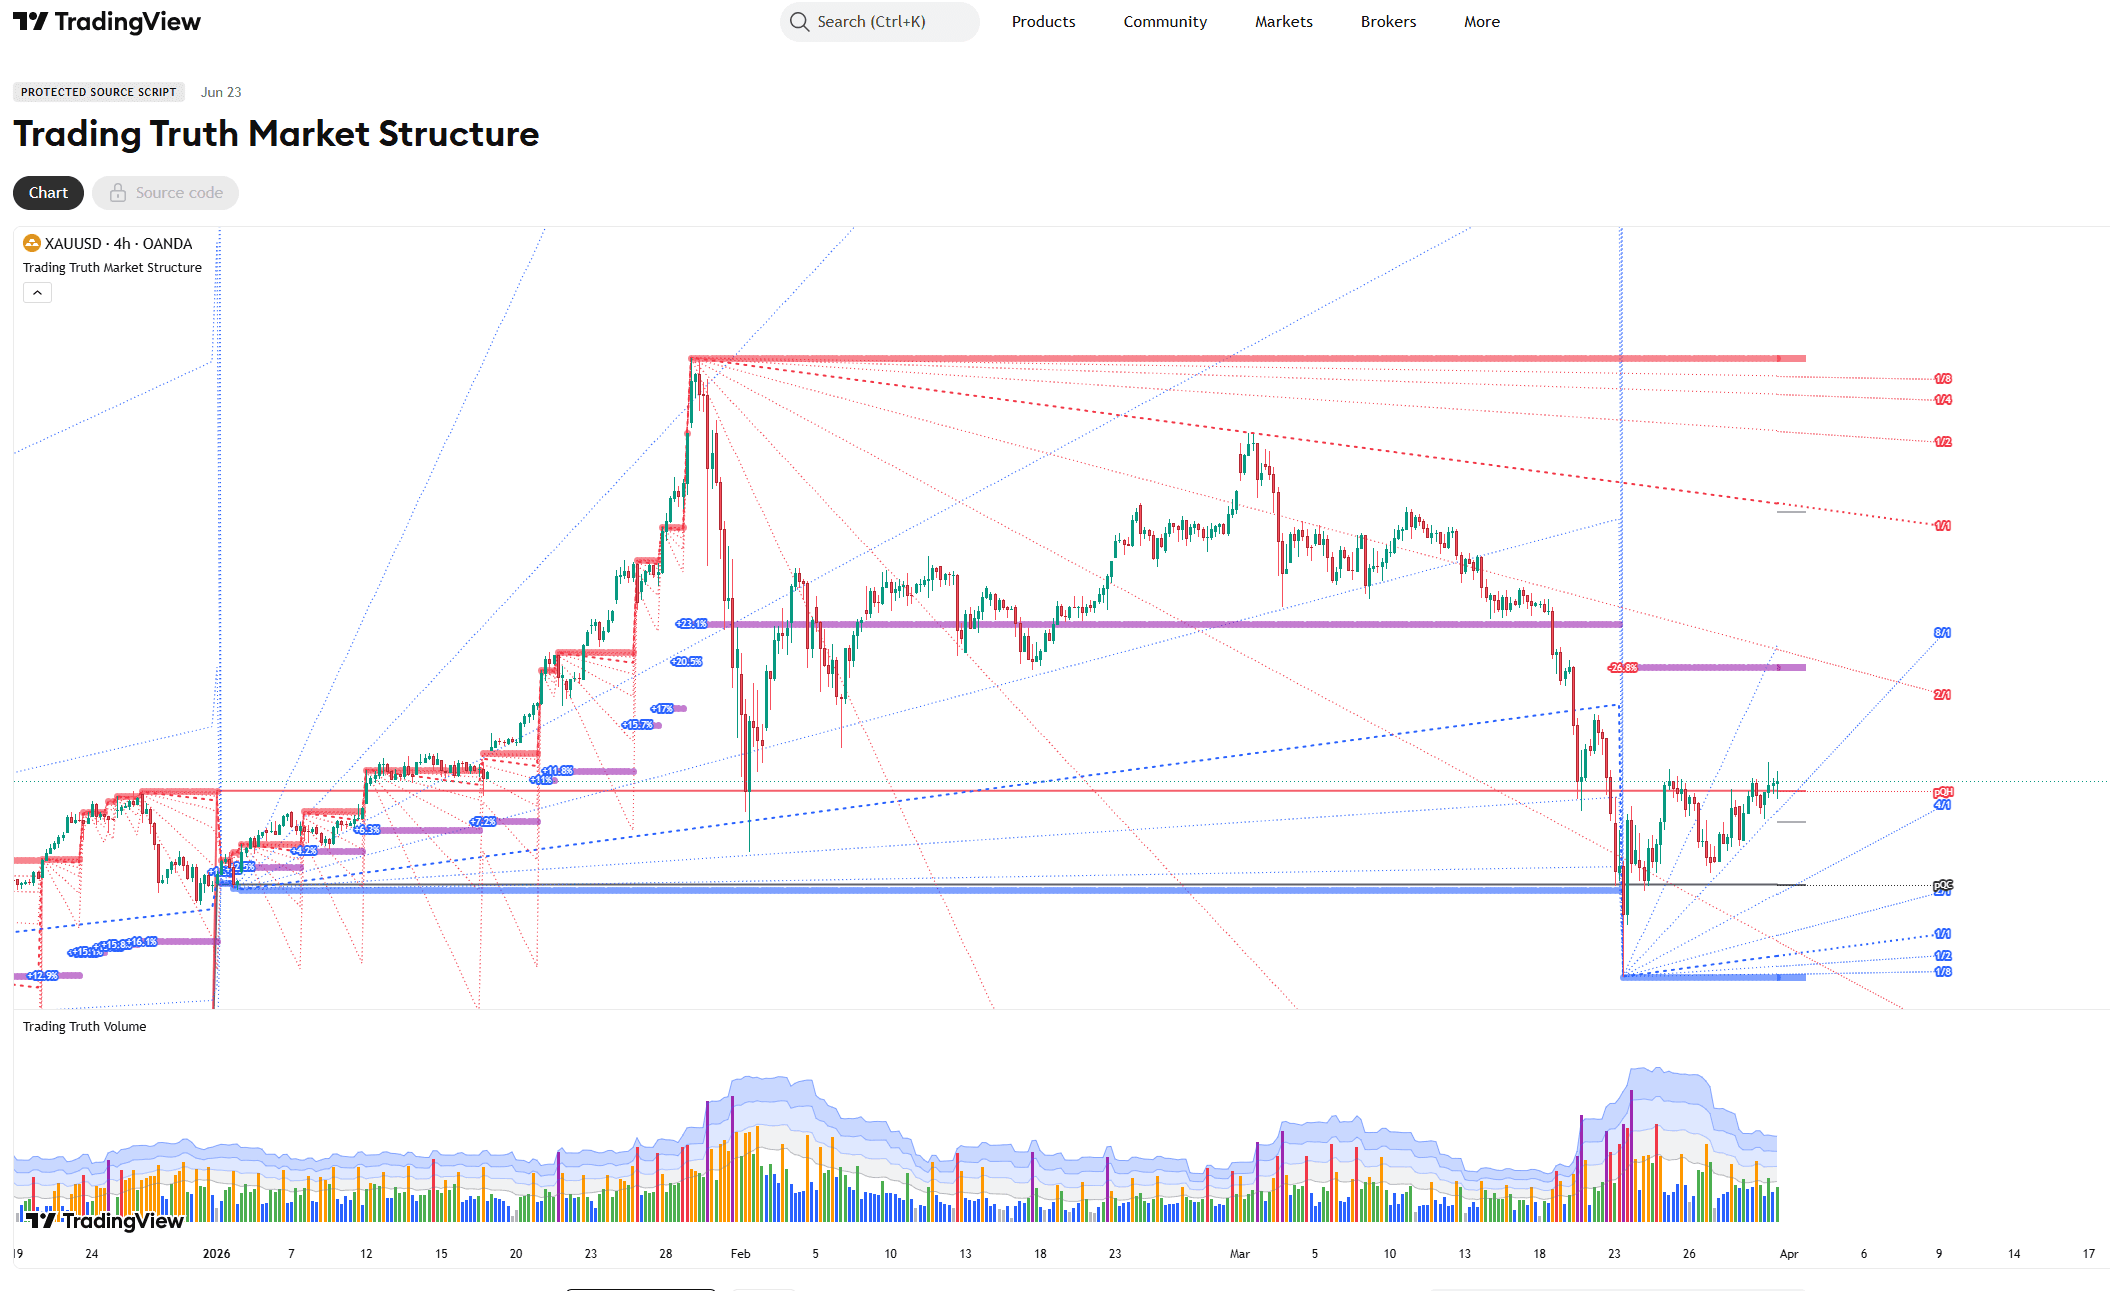
Dynamic geometric angles from swing points reveal natural support/resistance zones. Auto HTF detection, time cycles, and volume heatmap integration.
Markets
Recommended Timeframes
Key Features
- Dynamic geometric angles (1x1 through 16x1)
- Auto HTF detection and mapping
- Time cycles with vertical lines
- Volume heatmap integration
- 4-level target projection system
- Multi-market support
Overview
This indicator harnesses W.D. Gann's geometric principles to decode market structure through angular price projections, time cycles, and mathematical harmony—delivering precision entries with geometric confluence. The system plots dynamic trendlines from key swing points, creating a geometric grid that reveals natural support/resistance zones. It features ascending and descending angles (1x1 through 16x1), geometric target zones, time cycles with vertical lines, and automatic higher timeframe structure detection. Key capabilities include: - Dynamic geometric angle system from swing points - Auto HTF detection and mapping - Developing HH/LL/Midpoint tracking - 4-level target projection system - Time cycle division and future projection - Volume heatmap integration (wick colors) - Multi-market support (Crypto/Forex/Stocks/Futures)
Complete Documentation
Full release notes and trading guide
================================================================================
📐 GEOMETRIC TRADING SYSTEM v1.0
🎯 Gann-Inspired Angular Momentum & Cycle Detector
================================================================================

This indicator harnesses W.D. Gann's geometric principles to decode market
structure through angular price projections, time cycles, and mathematical
harmony—delivering precision entries with geometric confluence.

================================================================================
🔷 CORE GEOMETRIC ANGLES (Price Projections)
================================================================================

The system plots dynamic trendlines from key swing points, creating a geometric
grid that reveals natural support/resistance zones.

--------------------------------------------------------------------------------
📈 ASCENDING ANGLES (Bullish Structure)
--------------------------------------------------------------------------------

📐 1x1 (45° Angle)
→ The primary bullish trendline—balanced time and price momentum.

⚡ 2x1 (Steep Rally)
→ Aggressive bullish angle

🚀 3x1 (Parabolic)
→ Extreme momentum—unsustainable but marks blow-off tops.

🌊 4x1, 8x1, 16x1
→ Ultra-steep angles for measuring mania phases and exhaustion zones.

🐢 1x2, 1x3, 1x4, 1x8
→ Shallow angles—consolidation and accumulation patterns.

--------------------------------------------------------------------------------
📉 DESCENDING ANGLES (Bearish Structure)
--------------------------------------------------------------------------------

📐 1x1 (45° Decline)
→ Primary bearish trendline—orderly distribution.

⚡ 2x1 (Sharp Selloff)
→ Accelerating decline

💀 3x1 (Capitulation)
→ Panic selling—marks bottoming process initiation.

🌊 4x1, 8x1, 16x1
→ Crash-level angles for extreme fear and reversal zones.

🐌 1x2, 1x3, 1x4, 1x8
→ Controlled distribution and topping patterns.

================================================================================
🎯 GEOMETRIC TARGET ZONES
================================================================================

The system calculates 4 Target Levels based on market structure:

--------------------------------------------------------------------------------
💚 LONG TARGETS (From Swing Low)
--------------------------------------------------------------------------------
TP1 (25%) → First profit zone, conservative exit
TP2 (50%) → Mid-range target, trend confirmation
TP3 (75%) → Extended target, strong momentum
TP4 (100%) → Full range extension, maximum projection

--------------------------------------------------------------------------------
🔴 SHORT TARGETS (From Swing High)
--------------------------------------------------------------------------------
TP1 (25%) → First decline target
TP2 (50%) → Mid-distribution zone
TP3 (75%) → Deep retracement level
TP4 (100%) → Full range collapse projection

================================================================================
🧬 TIME CYCLES & VERTICAL LINES
================================================================================

Markets move in TIME as much as in PRICE. The system marks natural time turning
points throughout each cycle.

🌦️ GEOMETRIC CYCLES

- Black vertical lines mark natural time turning points
- Gray projected lines show future cycle timing
- Price often reverses or accelerates at these temporal nodes

💡 PRO TIP: Watch for geometric angle + cycle confluence—when price hits a 1x1
line AT a cycle vertical, reversals are high probability.

================================================================================
📊 HIGHER TIMEFRAME (HTF) STRUCTURE DETECTION
================================================================================

The system automatically maps your current timeframe to the optimal HTF for
context:

⏱️ AUTO HTF MAPPING

Current TF → HTF Context Purpose
──────────────────────────────────────────────────────────────
5 seconds → 15m Scalper's structural frame
1 minute → 1D Intraday anchor
5 minutes → 3D Swing trader's guide
15 minutes → 1W Position structure
1 hour → 1M Investor's roadmap
4 hours → 3M (Q) Quarterly rhythm
Daily → 12M (Y) Annual cycle

🎯 HTF LEVELS TRACKED

🟢 Developing HH (High) → Green circles—resistance zone at HTF swing high

🟣 Midpoint → Purple circles—equilibrium between HH and LL (most important)

🔴 Developing LL (Low) → Red circles—support zone at HTF swing low

Upper/Lower Quarters → Gray circles—25% subdivisions for precision entries

================================================================================
🟢 LONG TRADE RULES (Geometric Playbook)
================================================================================

--------------------------------------------------------------------------------
Entry 1: Midpoint Cross (High Conviction)
--------------------------------------------------------------------------------
Setup: Price crosses ABOVE HTF Midpoint with ultra-high or very high volume

Confluence: Ascending 1x1 angle also crosses up

📥 Entry: Close above midpoint + volume spike

🛑 Stop: Below swing low or 1x2 angle

🎯 TP: TP1 (25%) → TP2 (50%) → TP3/TP4 (trail)

📊 Volume: Ultra-high or very high required

--------------------------------------------------------------------------------
Entry 2: Lower Quarter Bounce (Mean Reversion)
--------------------------------------------------------------------------------
Setup: Price crosses above 1x1 ascending angle AND lower quarter midpoint

📥 Entry: Confluence of geometric angle + structural level

🛑 Stop: Below LL developing swing low

🎯 TP: Midpoint → HH

📊 Volume: High volume on bounce = stronger setup

--------------------------------------------------------------------------------
Entry 3: 1x1 Angle Reclaim (Trend Continuation)
--------------------------------------------------------------------------------
Setup: Price pulls back to 1x1 ascending line and holds

📥 Entry: Bounce off 1x1 with bullish candle confirmation

🛑 Stop: Below 1x2 angle (shallow support)

🎯 TP: Next cycle vertical line or TP levels

📊 Volume: Decreasing volume on pullback = healthy

================================================================================
🔴 SHORT TRADE RULES (Geometric Playbook)
================================================================================

--------------------------------------------------------------------------------
Entry 1: Midpoint Breakdown (High Conviction)
--------------------------------------------------------------------------------
Setup: Price crosses BELOW HTF Midpoint with ultra-high or very high volume

Confluence: Descending 1x1 angle also breaks down

📤 Entry: Close below midpoint + volume spike

🛑 Stop: Above swing high or 1x2 descending angle

🎯 TP: TP1 (25%) → TP2 (50%) → TP3/TP4 (trail)

📊 Volume: Ultra-high or very high required

--------------------------------------------------------------------------------
Entry 2: Upper Quarter Rejection (Distribution)
--------------------------------------------------------------------------------
Setup: Price fails at upper quarter or descending 1x1 angle

📤 Entry: Rejection with bearish volume spike

🛑 Stop: Above HH developing swing high

🎯 TP: Midpoint → LL targets

📊 Volume: High volume rejection = strong signal

--------------------------------------------------------------------------------
Entry 3: 1x1 Angle Breakdown (Trend Reversal)
--------------------------------------------------------------------------------
Setup: Price breaks and closes below ascending 1x1 line

📤 Entry: Failed support becomes resistance

🛑 Stop: Above 1x2 descending angle

🎯 TP: Previous LL or TP levels

📊 Volume: Expanding volume on breakdown

================================================================================
🎨 VOLUME HEAT MAP (Integrated Wick Colors)
================================================================================

The system colorizes candle wicks to reveal volume intensity:

💜 Ultra High (2.2x avg) → Climax volume—major moves or reversals

🔴 Very High (1.8x avg) → Strong institutional activity

🟠 High (1.2x avg) → Above-average participation

🟢 Normal (0.8-1.2x avg) → Healthy trending volume

🔵 Low (0.4-0.8x avg) → Weak conviction

⚪ Very Low (<0.4x avg) → Low liquidity—avoid entries

NOTE: Bodies remain black/white for clarity—only wicks show volume intensity.

================================================================================
⚙️ INDICATOR SMART FEATURES
================================================================================

🔧 CUSTOMIZATION SETTINGS

🧭 HIGHER TIMEFRAME PLOTS
- Toggle HTF OHLC reference lines
- Show/hide developing HH, LL, Midpoint levels
- 1x1 trend from HTF close option

📐 ASCENDING TREND PLOTS
- Enable/disable all ascending angles
- Selectable angles: 1x1, 2x1, 3x1, 4x1, 8x1, 16x1
- Shallow angles: 1x2, 1x3, 1x4, 1x8, 1x16

📐 DESCENDING TREND PLOTS
- Enable/disable all descending angles
- Same ratio options as ascending

🎯 TARGET SETTINGS
- Toggle long/short target display
- Plot 1x1 angles from target levels
- Extend target lines to the right

🧬 TIME & CYCLES
- Show/hide geometric cycles
- Display future cycle projections
- Adjustable cycle divisions (default: 12)

🏷️ LABELS
- OHLC level labels
- Target percentage labels
- Range expansion % display

➡️ LINE EXTENSIONS
- Extend geometric angles right
- Extend target lines right

================================================================================
🔔 ALERT SETUP (Coming in v2.0)
================================================================================

Currently manual—visual signals only. Future version will include:
- Midpoint cross alerts
- Geometric angle breakout alerts
- Cycle + angle confluence notifications

================================================================================
💎 PRO TRADING NOTES
================================================================================

🎯 CONFLUENCE IS KING

Best Setups: Geometric angle + HTF level + Time cycle + Volume spike

Example: Price hits 1x1 ascending angle at midpoint during cycle vertical
with ultra-high volume = monster trade

--------------------------------------------------------------------------------
📐 ANGLE HIERARCHY
--------------------------------------------------------------------------------
1x1 = Most reliable (balance)
2x1 = Strong momentum confirmation
4x1 & 8x1 = Exhaustion zones, expect reversals
1x2 & 1x4 = Accumulation/distribution patterns

--------------------------------------------------------------------------------
🌦️ MARKET PHASE CONTEXT
--------------------------------------------------------------------------------
Trending Markets: Trade WITH the dominant angle (1x1 or 2x1)

Ranging Markets: Fade extremes (4x1, 8x1 angles)

Breakouts: Wait for 1x1 reclaim after consolidation

--------------------------------------------------------------------------------
🎨 VOLUME INTEGRATION
--------------------------------------------------------------------------------
Entry Quality: Require High/Very High/Ultra High volume for entries

Pullbacks: Low/Very Low volume = healthy correction

Reversals: Ultra High volume at geometric angle = high-probability turn

--------------------------------------------------------------------------------
🧬 TIME CYCLE STRATEGY
--------------------------------------------------------------------------------
Early Cycle: Look for continuation setups (1x1 holds)

Mid Cycle: Profit taking zones (TP2/TP3)

Late Cycle: Expect reversals at next vertical line

Cycle Break: Strong trends extend 1-2 cycles beyond—trail stops

--------------------------------------------------------------------------------
📊 HTF STRUCTURE RULES
--------------------------------------------------------------------------------
Uptrend: Only long when above midpoint, shorts when midpoint breaks

Downtrend: Only short below midpoint, longs when midpoint reclaims

Range: Fade HH/LL extremes, buy/sell at midpoint based on volume

================================================================================
🆘 TROUBLESHOOTING
================================================================================

Q: Lines not showing?
A: - Check that "Enable Ascending/Descending Plots" is ON
- Select specific angles (1x1, 2x1, etc.) you want to display

Q: Too many lines?
A: - Start with just 1x1 and 2x1 angles
- Hide target lines if chart is cluttered
- Reduce cycle divisions to 6 or 8

Q: HTF levels seem wrong?
A: - System auto-maps HTF based on your current timeframe
- Check that you're on a supported timeframe (1m, 5m, 15m, 1H, 4H, 1D)
- Non-standard timeframes may default to 1D HTF

Q: Volume colors not working?
A: - Volume heatmap is on wick colors only
- Ensure "Color Candles" is enabled in code (default ON)

Q: Angles don't match chart movement?
A: - Geometric angles project FORWARD from swing points
- Not support/resistance—they are dynamic momentum guides
- Price should react when crossing angles, not necessarily follow them

Q: Works on all markets?
A: - ✅ Crypto (24/7)
- ✅ Forex (24/5)
- ✅ Stocks (limited hours)
- ✅ Futures
- System automatically adjusts calculations for market type

Q: Best timeframes?
A: - Scalping: 1m, 5m (HTF: 1D, 3D)
- Day Trading: 15m, 1H (HTF: 1W, 1M)
- Swing Trading: 4H, 1D (HTF: 3M, 12M)

Q: Repainting?
A: - HTF levels update as swings develop (expected behavior)
- Confirmed swings and angles do NOT repaint
- Final geometric structure locks after swing confirmation

================================================================================
📜 VERSION HISTORY
================================================================================

v1.0 (Current - January 2025)
✅ Dynamic geometric angle system (1x1 through 16x1)
✅ Auto HTF detection and mapping
✅ Developing HH/LL/Midpoint tracking
✅ 4-level target projection system
✅ Time cycle division and future projection
✅ Volume heatmap integration (wick colors)
✅ Multi-market support (Crypto/Forex/Stocks/Futures)
✅ Customizable angle and target displays
✅ Target levels based on market structure
✅ Historical level tracking (last 3 swings)
✅ Range expansion calculation

Planned v2.0
🔜 Built-in alert system (angle cross, midpoint break)
🔜 Gann Square of 9 integration
🔜 Automated angle confluence scoring
🔜 Multi-timeframe angle alignment display
🔜 Enhanced cycle prediction algorithm

================================================================================
🧠 THE GEOMETRY BEHIND THE SYSTEM
================================================================================

W.D. Gann's Core Principles Applied

1. Price and Time Must Balance
→ 1x1 angle represents perfect equilibrium

2. Natural Resistance Points
→ Markets respect geometric angles as hidden S/R

3. Angles Repeat
→ Same ratios work across all timeframes and instruments

4. Cycle Harmony
→ Time is as important as price—vertical lines mark natural turns

5. Volume Confirms Geometry
→ Angular breaks without volume are false signals

WHY THIS WORKS

- Mathematical Harmony: Markets naturally gravitate to Gann angles due to
mass psychology and algorithmic trading

- Self-Fulfilling: Professional traders watch these levels, creating real
support/resistance

- Universal Application: Same geometric laws apply to Bitcoin, Gold, SPX,
EURUSD

- Time-Price Symmetry: The 1x1 angle represents the natural pace of
trending markets

================================================================================
⚠️ RISK DISCLAIMER
================================================================================

This indicator is an EDUCATIONAL TOOL based on geometric trading principles.
It does NOT guarantee profits. Markets involve substantial risk of loss.

- Always use stop losses
- Size positions based on account risk (1-2% per trade)
- Combine with proper risk management
- Backtest before live trading
- No system wins 100% of the time

================================================================================
🎓 LEARNING PATH
================================================================================

BEGINNER
1. Start with just 1x1 angles (ascending + descending)
2. Learn to identify HTF Midpoint as primary bias filter
3. Trade only WITH the geometric trend (1x1 direction)
4. Use TP1 and TP2 for initial targets

INTERMEDIATE
5. Add 2x1 angles for momentum confirmation
6. Incorporate time cycle verticals for entry timing
7. Use volume heatmap to filter low-quality setups
8. Start scaling out at multiple target levels

ADVANCED
9. Trade geometric confluence zones (angle + HTF level + cycle)
10. Use 4x1/8x1 angles to identify exhaustion and reversals
11. Combine 1x2/1x4 angles for consolidation pattern recognition
12. Develop custom strategies for specific market conditions

================================================================================
💬 FINAL WORDS FROM THE ARCHITECT
================================================================================

"Price moves in angles, time moves in cycles. Master the geometry, and you'll
see the market's blueprint before it unfolds. The 1x1 is your compass—
everything else is just decoration."

The market is not random—it's geometric. Learn the angles, respect the cycles,
and let the structure guide your trades.

================================================================================

🚀 Trade the Geometry, Not the Noise

© 2025 AstroTrade_ | Invite-Only TradingView Script

================================================================================